
CHECK PRICE OR BUY NOW
JOIN THE DISCUSSION
Overview
Created by Investors Business Daily, MarketSmith is a stock research platform that’s loaded with great features and is ideal for adherents to the CAN SLIM system. By providing solid stock ideas, scans of high-probability chart patterns, and powerful technical analysis tools, MarketSmith helps members to identify winning stocks before they breakout.
In this MarketSmith review, we’ll take an in-depth look at IBD’s popular software program and find out if it’s really worth the money.
Software Details
| Developer | Investors Business Daily |
| Founded | 1999 |
| Platform | Browser-based |
| Included | Stock screener, advanced charts, IBD stock lists and proprietary scans, technical analysis tools, video lessons, webinars, mobile app, product coach |
| Subscriptions | Monthly |
| Price | Click here |
| Coupon Code | No promo code currently available |
Community Rating
Photos
About IBD and William O'Neil
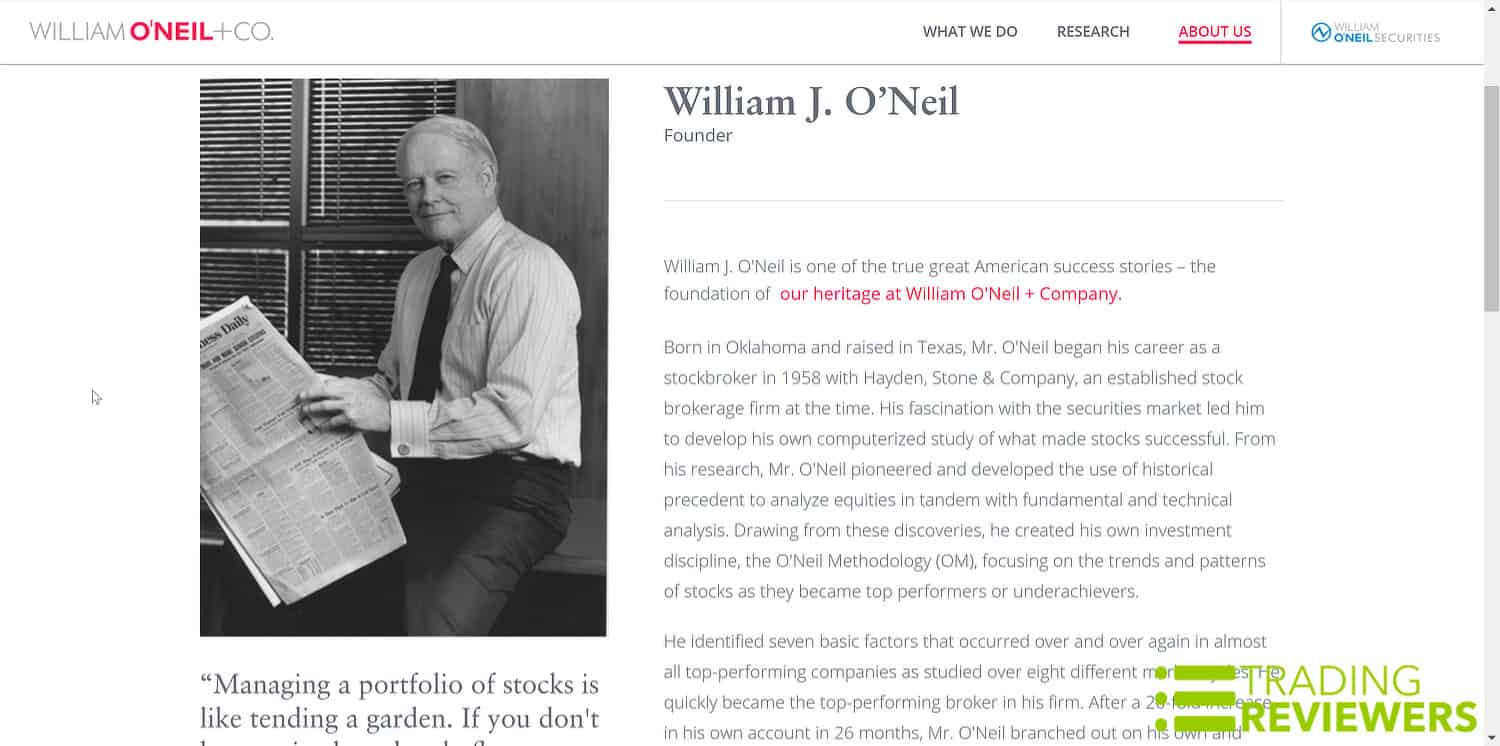
In 1984, William O’Neil founded Investors Business Daily as a print publication. The famous investor’s motivation for creating Investors Business Daily was to offer investors a way to identify winning stocks with a strategy that he developed as a young stockbroker. Early in his career, O’Neil sought to discover the characteristics of superperformance stocks and the ideal time to buy them. By studying the greatest stocks in history, he discovered the foundations of an investment strategy known as CAN SLIM, an acronym that stands for:
- C = Current Quarterly Earnings: Qualifying stocks have current quarterly earnings of 25% or more
- A = Annual Earnings Growth: Stocks must have a 3-year earnings growth of 25% or more
- N = New Product, Service, Management, or High Price Point: Companies that offer innovative products and services
- S = Supply and Demand: When a limited amount of shares struggle to meet investor demand, the price goes up, especially due to accumulation by institutional investors
- L = Leader or Laggard: A key element in most growth strategies, looking for leaders in top industries with impressive earnings growth and great sales
- I = Institutional Sponsorship: Follow the big money
- M = Market Direction: Swim with the current as research shows that the majority of stocks follow market trends
CAN SLIM is the trading system that’s detailed in O’Neil’s best-selling book, How to Make Money in Stocks. This proven strategy routinely beats the S&P 500 in both good and bad markets, and IBD has incorporated its core investment strategy into both of their flagship research platforms — Leaderboard and MarketSmith. Although these two platforms share similarities, IBD designed Leaderboard for casual investors and MarketSmith for active investors who prefer to do their own research.
MarketSmith is the offspring of Daily Graphs, which was O’Neil’s weekly subscription service that provided books of stock charts. In 1998, IBD converted the books into charts and published them on the Internet as Daily Graphs Online. Even after its transformation into MarketSmith, the platform retained O’Neil’s goal of offering investors the same caliber of research tools available to institutional investors.
What's Included
You can access MarketSmith by desktop, tablet, or mobile phone. After you log in, the member page gives you an immediate indication of the day’s market dynamics with Market Pulse. From this page, you can also browse through some of the highlighted video lessons from MarketSmith University, notifications for upcoming webinars, blogs, and other resources.
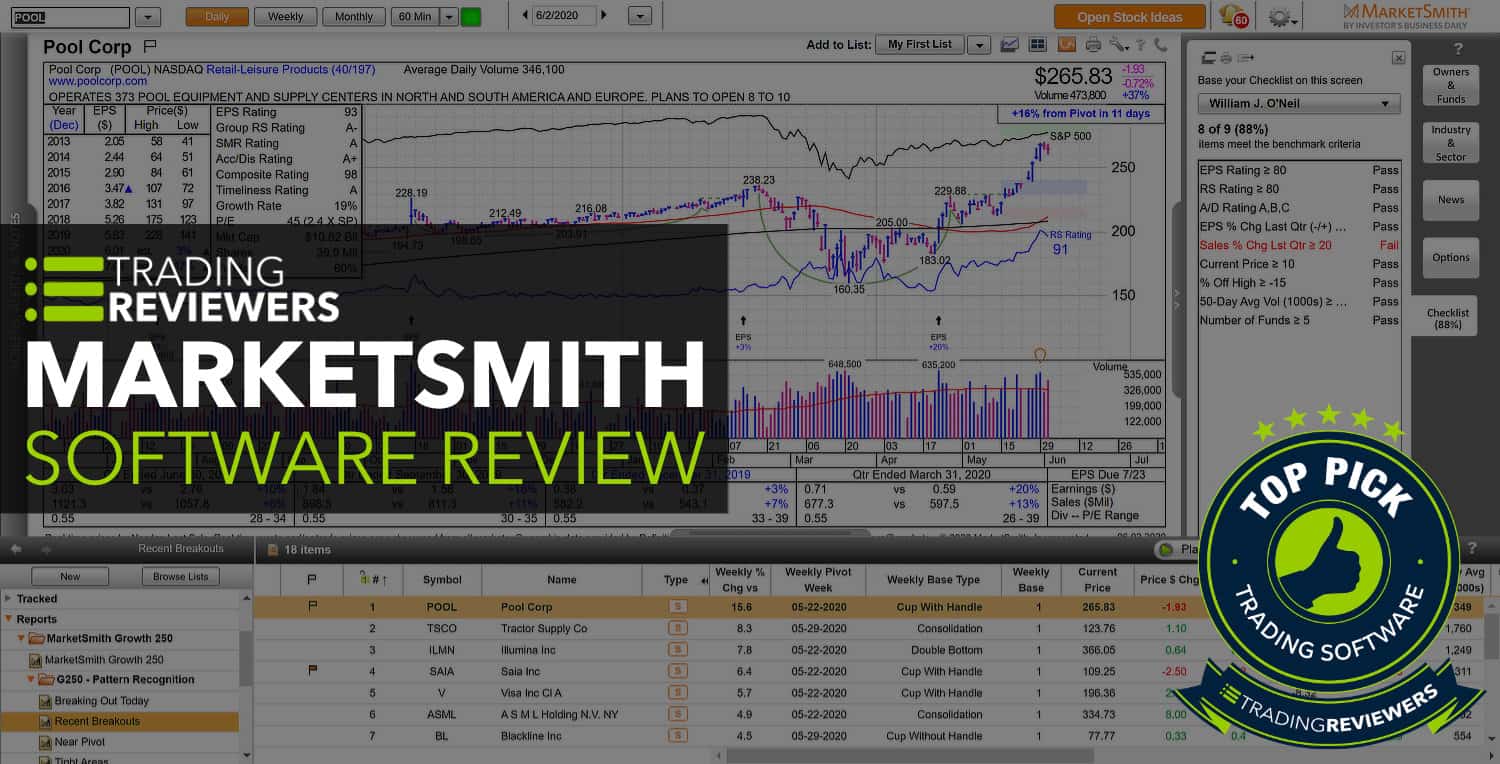
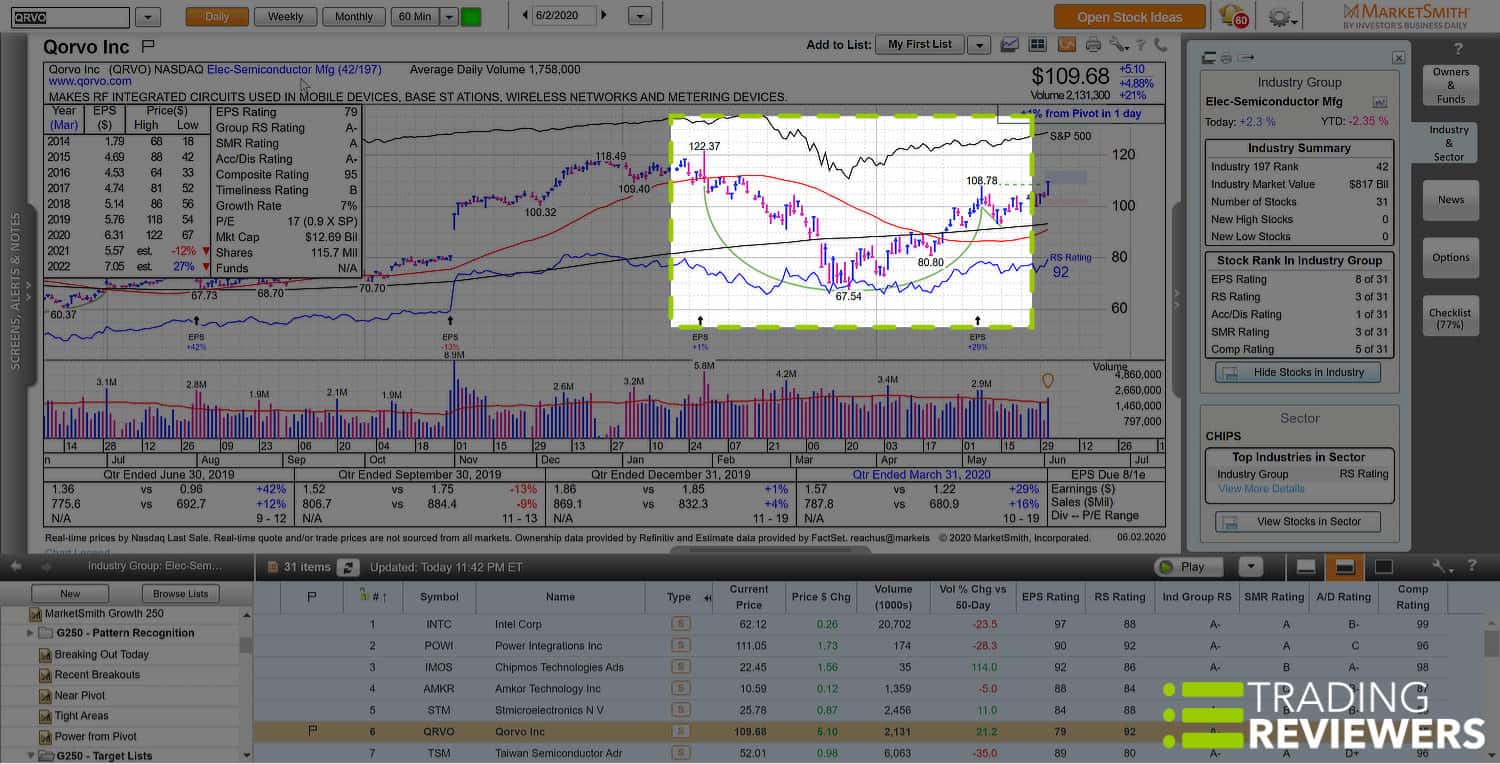
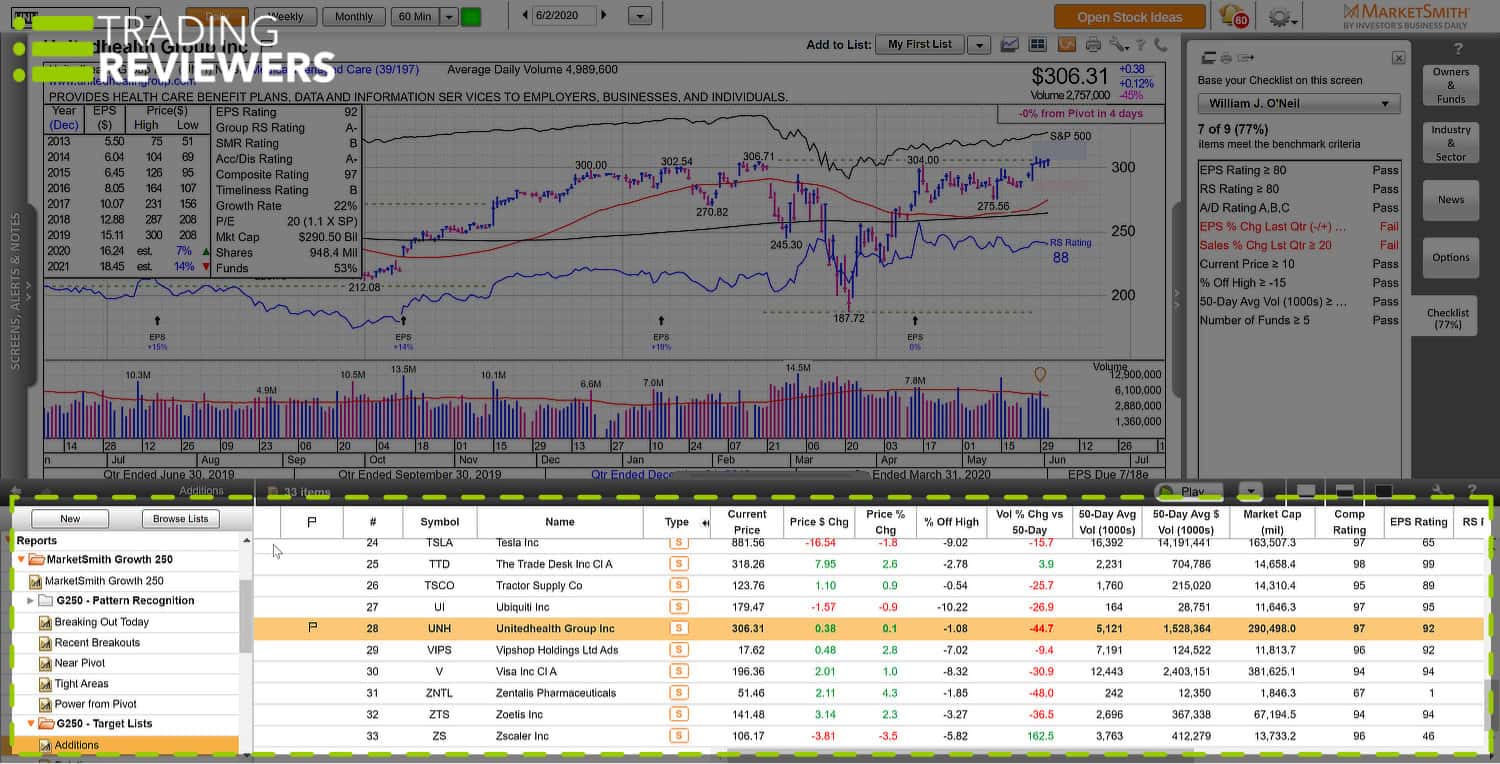
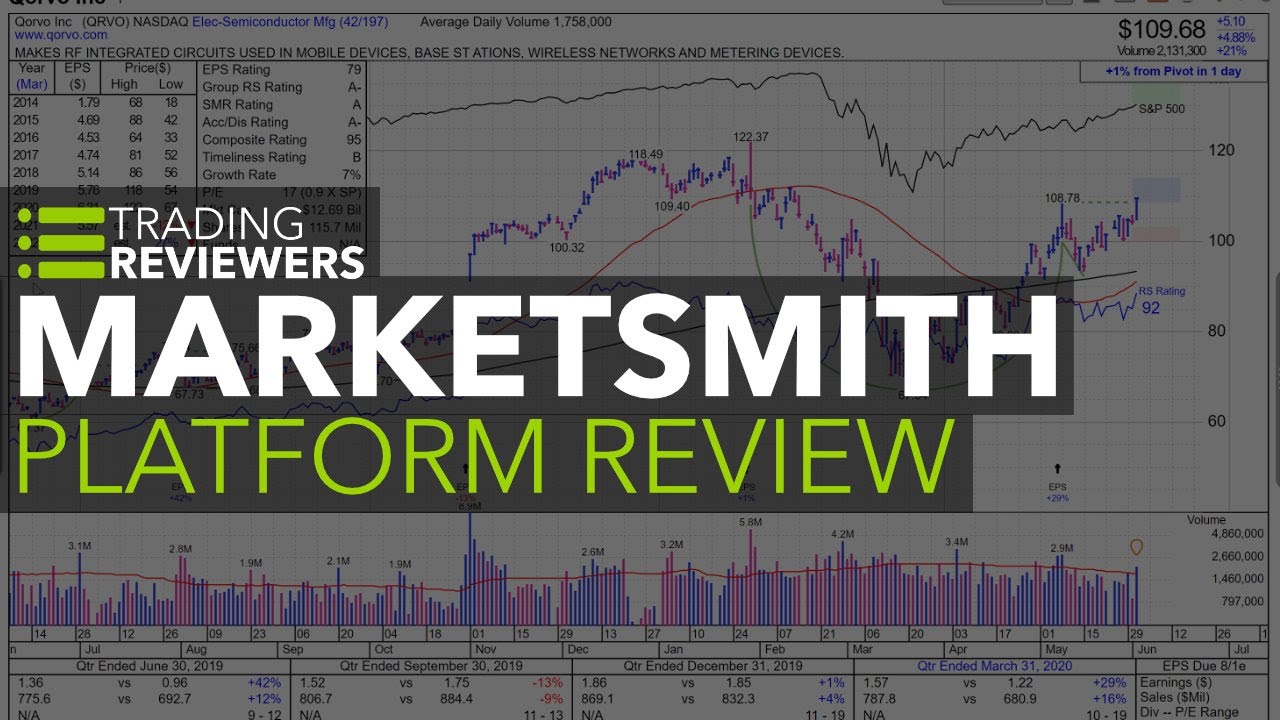
In the upper right corner, the Open Charts button leads you to all the goodies. Just enter a ticker into the upper left corner of the stock charts platform and it will instantly display the stock’s fundamentals as well as important technical analysis data. The fundamentals include the Investors Business Daily proprietary ratings and the quarterly earnings block. To help you fine-tune the timing of your trades, MarketSmith’s pattern recognition feature analyzes chart patterns and uses line indicators to signal when a stock price is likely to make a move.
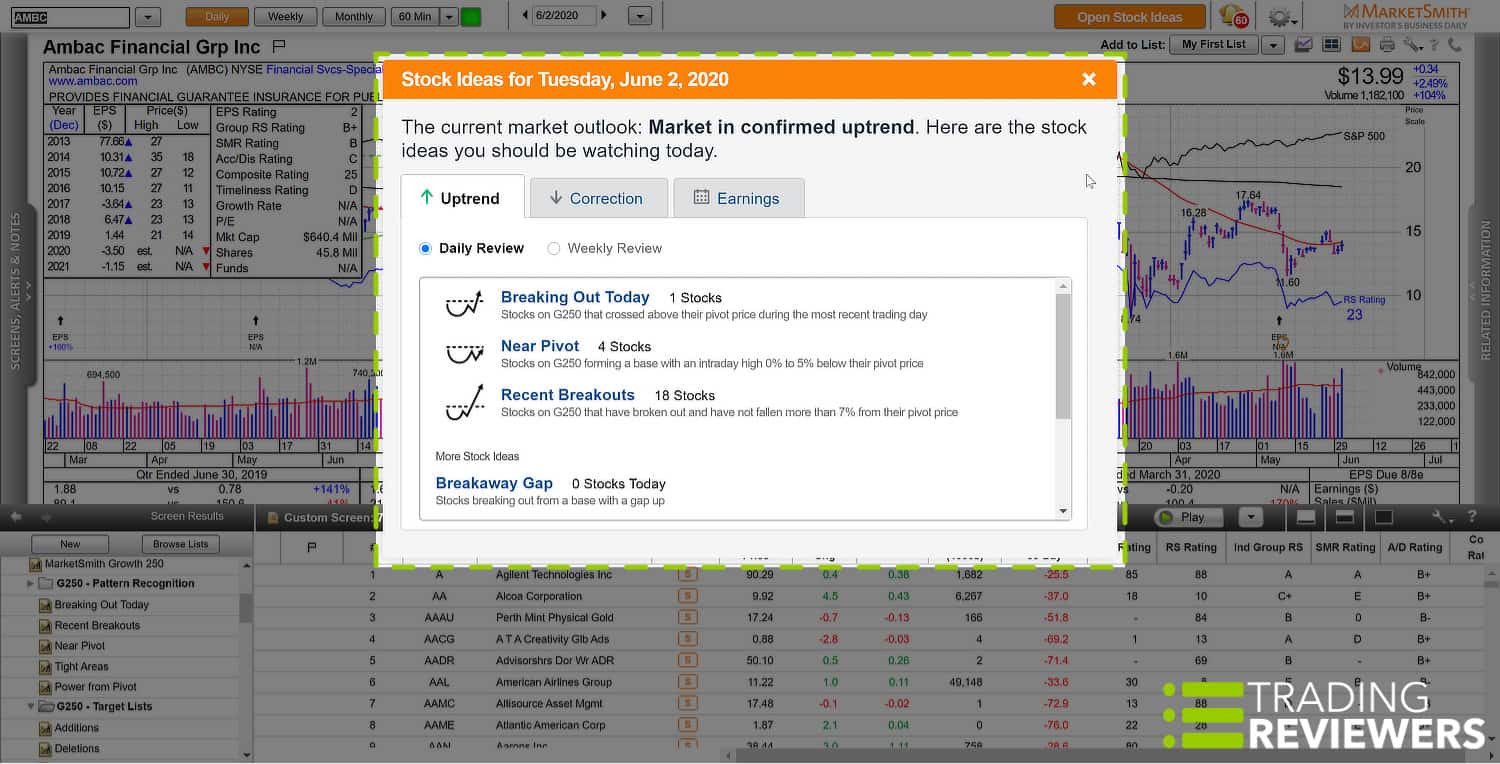
Located in the upper right corner of the charts page, the Open Ideas button generates stock ideas with names in an uptrend, correction, or with earnings activity. Also, you can find other great trading ideas on MarketSmith’s watch list manager, which includes the MarketSmith Growth 250. If you want to create your own custom watch lists, you can use the platform’s screener tool located on the left side of the screen.
Additionally, you can do more in-depth research at the learning center and we highly recommend taking advantage of the free personalized training provided by MarketSmith’s product coach support.
MarketSmith Charts
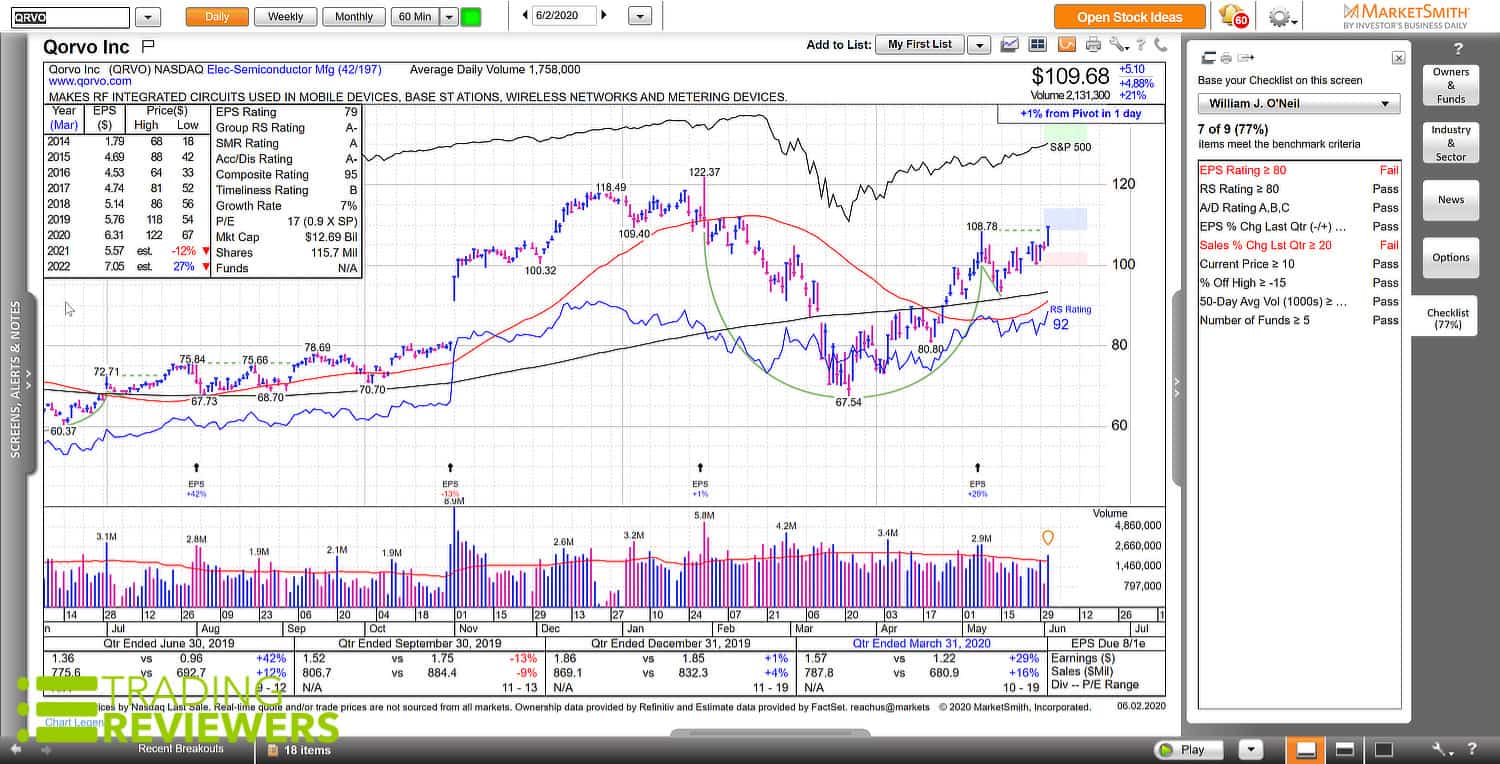
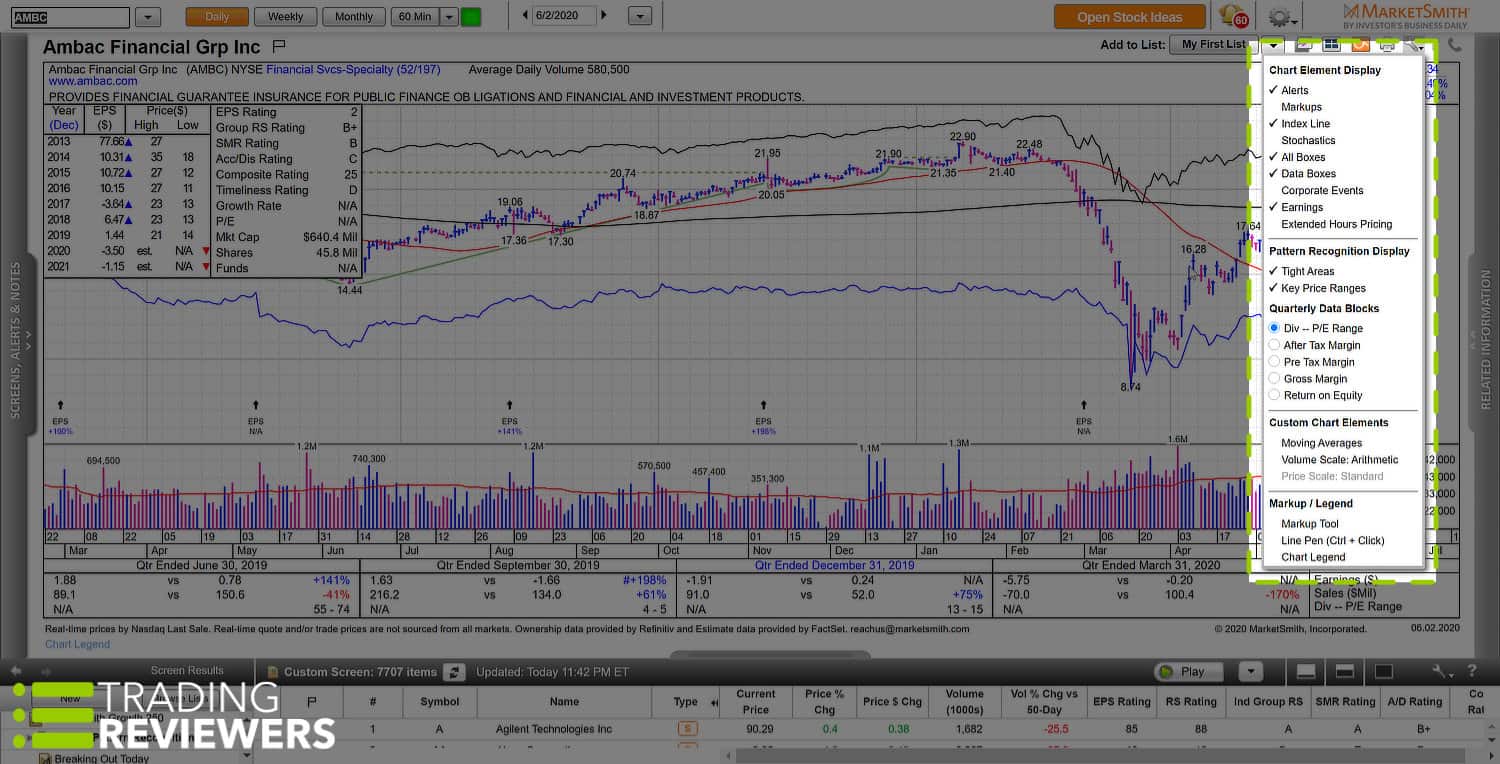
Because MarketSmith’s charts feature fundamental data and technical indicators, it attracts investors, traders, and even day traders. These stock charts give you a rundown of current market conditions with 70 indicators, individual data items, and proprietary Investors Business Daily rating and ranking scores. Also, the time frames of the stock charts range from daily, weekly, monthly, and intraday (1 minute, 5 minutes, 10 minutes, 15 minutes, 30 minutes, 60 minutes).
MarketSmith’s stock charts are very helpful if you’re looking for stocks in the buy zone and they do a great job of identifying overall trends and chart patterns. Some of the features include:
- S&P 500 Index line: The most popularly used benchmark for stock market performance
- Markup and annotations: Useful for marking up charts with commentary
- Important events: Like insider trading and earnings reports
- Custom moving average lines: Great for determining trends, setting stop losses, etc.
- IBD‘s proprietary relative strength (RS) line: Uses recent closing price to indicate strength or weakness of a stock
MarketSmith also provides you with a wealth of information about a company’s fundamentals. Included are the following:
- Important fundamental data: Indicate a company’s financial well-being and growth potential
- Company profile and relevant updates
- Earnings
- Leading industry competitors
- Investors Business Daily proprietary rating and rankings: Includes EPS rating, group RS rating, SMR rating, composite rating, and more
Undoubtedly, the MarketSmith Pattern Recognition feature is one of the highlights of the platform. This premium feature detects the following nine chart patterns:
- Cup
- Saucer
- Flat base
- IPO base
- Saucer-with-handle
- Ascending base
- Consolidation
- Bottom
With one click, the program’s Pattern Recognition functionality identifies specific stock patterns and shows you pivot points and other areas of interest.
Stock Research
MarketSmith excels at providing you with a variety of research tools. The platform includes up to 50 years of historical price and volume data for analyzing stocks and indices, giving you the ability to study past market cycles and stock behavior.
By combining IBD‘s tried and true CAN SLIM investing principles and historical data, MarketSmith can quickly help you find the best stocks to trade.
Growth 250
Each Friday, Investors Business Daily‘s Growth 250 provides you with an updated list of high-potential stock ideas. This premium feature gives you time to review and research the data points before the stocks show gains. Plus, you get 60-second, intraday updates on stocks near the pivot or breakout points.
Essential, Growth 250 speeds up the stock finding process by doing the initial screen for you. To create the exclusive list, Investors Business Daily portfolio managers combine their proprietary ratings and rankings with 30 separate screens containing other important data such as:
- Price-performance
- Pretax margins
- Liquidity
- Earnings
- 3-Weeks-Tight Base Patterns
- Return on Investment
IBD managers use demanding criteria that result in a constant ticker turnover every week. As a result, market conditions can influence the number of stocks on the list. For example, a bull market typically contributes to a larger list and a bear market generally shortens the list. You can find this flagship list under the MarketSmith List Manager.
Screens
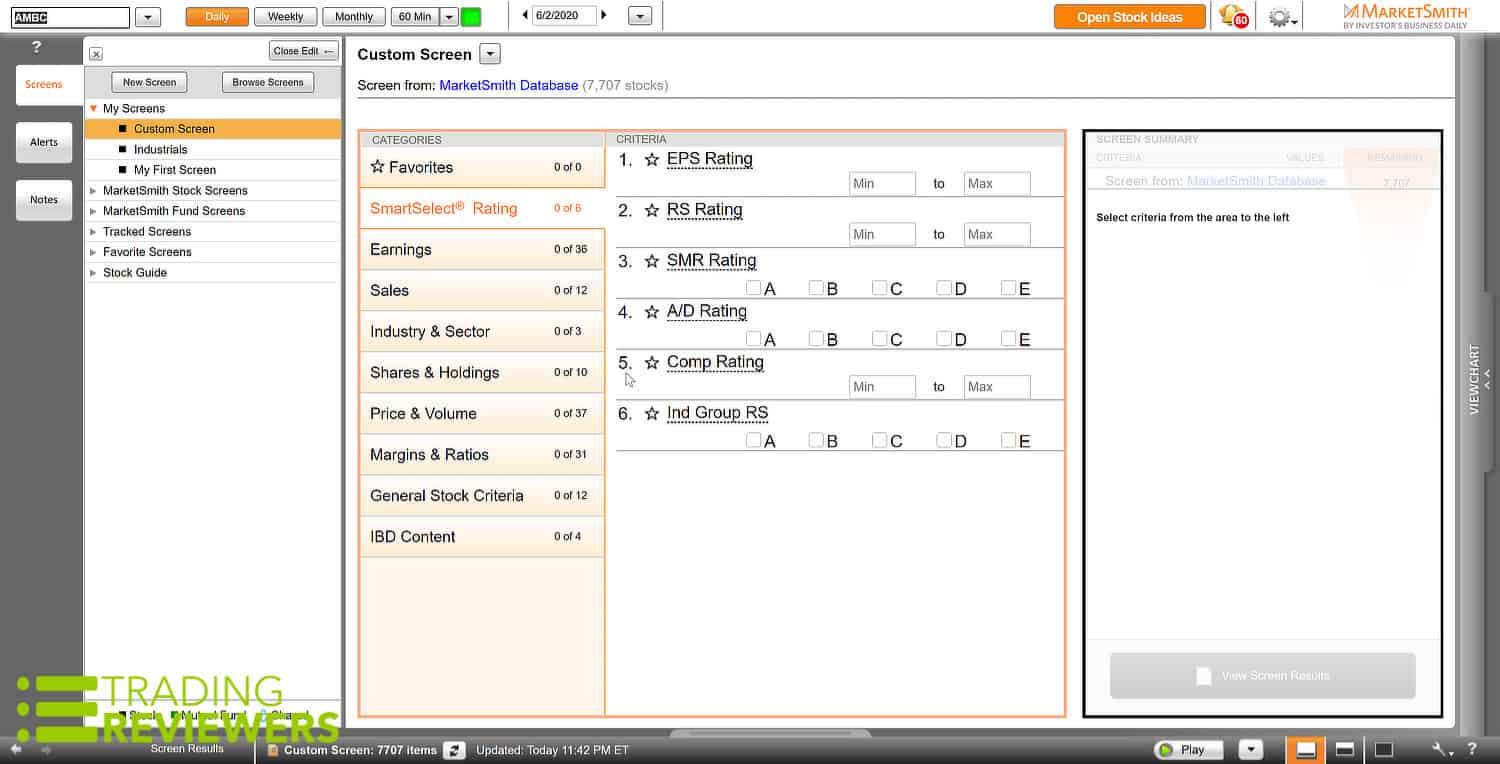
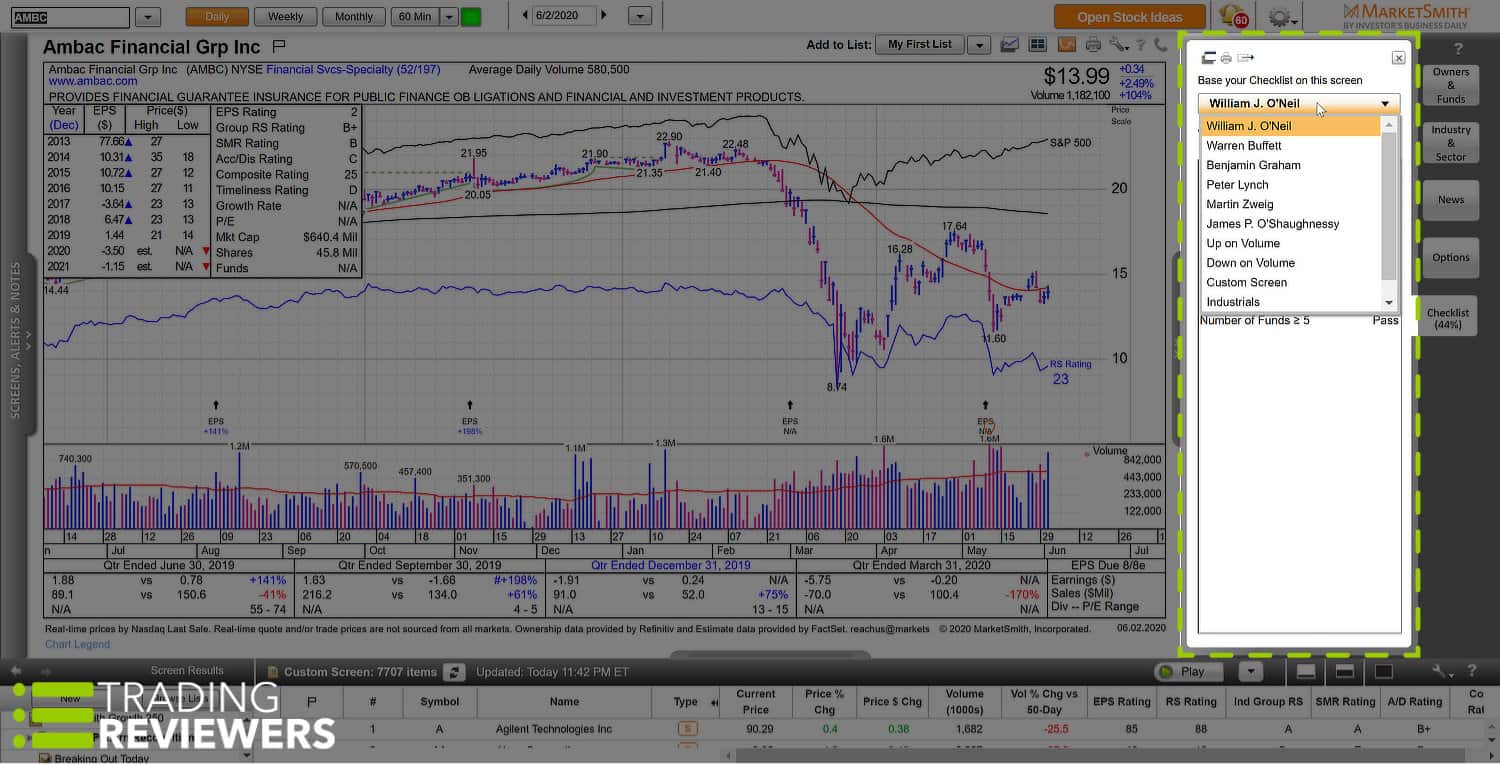
If you continue to browse through the MarketSmith List Manager, you’ll find the most popular screens and reports on the platform. The list includes screens from William O’Neal, Warren Buffet, Benjamin Graham, Peter Lynch, Martin Zweig, and James O’Shaughnessy. Also, there are up-on-volume and down-on-volume screens for you to review.
If you plan to search for your own stock ideas, you can select the screener tab to gain access to this research platform’s powerful screening tools. If you click the New Screen button, you can name your screen and select the screen parameters by category and criteria. This screener scans through 17,000 stocks, ETF’s, and funds at warp speed.
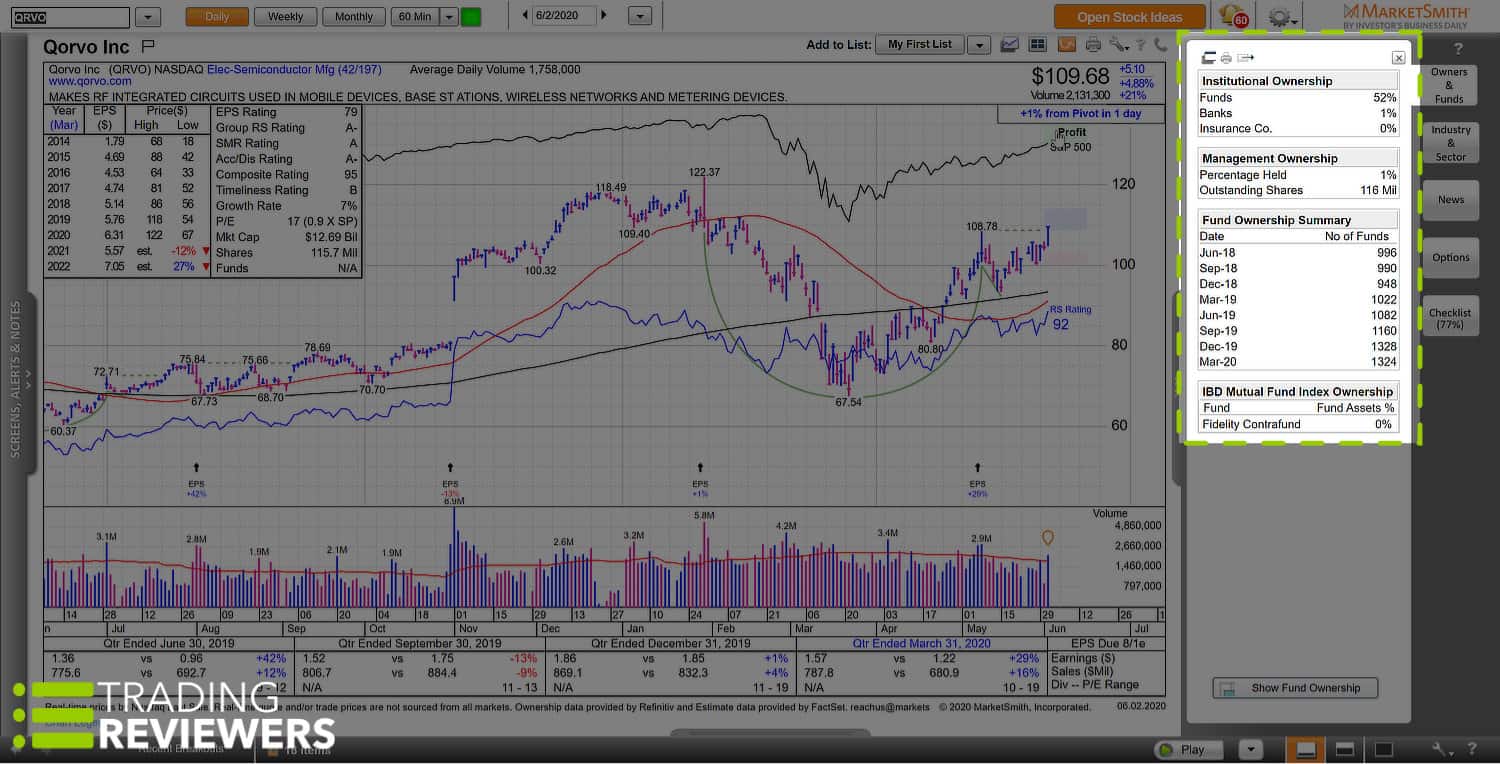
Once you have found stocks of interest, you can get extra information on your screen results by selecting the Related Information tab on the right side of the Charts page. This tool reveals useful information such as institutional, managerial, and fund ownership. Plus, it supplies relevant news, industry/sector fundamentals, and options. This screens feature has a remarkable collection of resources, and it is just as easy to use as Google’s search engine.
Video Tutorials
Because the market and its conditions are always evolving, investors must continually study and improve their trading strategies. The video library is one of the features that makes you feel like you’re part of an investment community. The platform’s video tutors are extremely helpful when it comes to understanding the CAN SLIM approach to choosing and trading winning stocks.
First of all, each feature page on the MarketSmith website has an accompanying video that explains the function and benefits of each feature and tool. Some videos reveal deep information about the platform. For instance, take a look at the Pattern Recognition video — it goes into great detail about that feature’s algorithmic properties.
The first row of thumbnails show instructional videos about research tools such as the chart analysis and screener overview. The second row of thumbnails displays a collection of investing videos with titles like:
- Investment Psychology: A Series Covering Fear, Hope, Pride, and Greed
- Weekly Report on Stock Approaching or at New Highs
- Cup and Handle Base Formation
- Related Info Panel
- Price Alerts and Breakouts Today
- Using Trend Template Screens to Find Winning Stocks
Webinars
The live webinar series can give you a board room experience when it comes to gaining new knowledge and sharing your experiences with other investors. As a MarketSmith member, you can sign up and reserve your “seat” for upcoming webinars. You can find the registration page under the Learn tab and on the registration page, you can read the bio of the senior product pros who will be leading the call.
The webinars mainly deal with stocks on the move and portfolio management as they relate to current market conditions and trends. For example, at the time of our MarketSmith review, the upcoming webinar features senior product pros, Irusha Peiris and Scott St Clair. They’ll be discussing how to use MarketSmith to find potential buys, the best time to add to your present winners, and rules for protecting your portfolio during a market shift. These calls are always a great resource when it comes to stock chart analysis and from time to time you’ll even get to hear from special guests like Mark Minervini and David Ryan, two very well-known growth stock gurus and MarketSmith users.
MarketSmith Mobile App

The MarketSmith Mobile App is Investors Business Daily‘s way of keeping you in touch with the market while you’re away from your trading desk. For stock charts, you have 70 technical and fundamental data fields. Among the performance reports are:
- Top-rated IPOs
- Weekly new highs
- Top EPS rating stocks
- Fastest growing companies
The app also allows you to set up email price alerts. Plus, you get to save and review your own screens and despite being displayed on a small device, the chart patterns are clearly visible.
Top-Shelf Customer Support
As a subscriber, you’ll also be assigned a MarketSmith product coach who will provide valuable guidance through one-on-one personal coaching sessions. This is very helpful when it comes to getting the most out of the platform and the product coaching team is a group of market experts who appear in many of the video tutorials and webinars.
Reader Reviews
Best research…
Little on the expensive side but hands down the best research website for fundamentals and tech. I love stockcharts but will not switch due to them not having some of the customer screens MS has such as the Minervini screeners, etc.
My experience with their support coaches has been great. I use a lot of IBD free products so I feel happy to contribute to IBD through MS.
Stay away…
Leaderboard is horrible. They pick stocks that are completely out of line with the IBD investing principles, and by the time they recommend buy something its reached its peak, then they tell you to sell at a loss. I honestly believe its a pump amd dump scam. I tried following Leaderboard investing principles on “paper” for a few months and I would have LOST about 20%. You’d be better off picking stocks by throwing darts at a dartboard. And they charge $70/month for that! Leaderboard isn’t about making money for investors, its about making money for IBD. STAY AWAY!!!
Awesome…
Awesome if you read How to Make Money in Stocks. The key is identify stocks being accumulated by big, smart money. Watch as they build a constructive base. And breakout higher when smart money’s buying volume makes it happen.
Slow and clunky…
Yes, it provides fundamental data and screening. However, it is extremely slow and clunky. Just changing to the next symbol takes a few seconds. The software is garbage. As for the charting, it’s ok and does provide interesting data. Here again, way too slow to be effective after coming up with a list of stocks. As for support it is ok, however the instructional videos and webinars have several so-called experts congratulating themselves on adding some small feature etc. Slimy, self-serving A-holes. No idea why the company allows this kind of presentations.
All this for $150 a month? Not worth it. This is really a $25 per month value at best. Not recommended.
Very helpful…
These bad reviews only show me that the individuals don’t know anything about CANSLIM. If they gave it enough time they would realize it is very helpful. I was, at first, disappointed that they don’t have candlesticks but now don’t care because everything else is so great.
Canceled my account after 24 hours…
Tried the 21 day trial. Watched many tutorials and scheduled two coaching sessions only to learn they do not offer any time on an individual basis as I was told when I signed up for the service. Was sent an email to join a group Zoom session, AFTER the meeting ended. Talked to training coach and customer service….. extremely rude and condescending. Not paying $1,500/year to a company that treats it customers so poorly. Canceled my account after 24 hours.
Still flaky…
Good techno-fundamental research tool but primitive charts. Real time data sometimes has extreme latency, and audio alerts stop working at random. They REFUSE to fix it, insisting it’s my fault. I even bought a new computer. Still flaky. I guess they don’t need my business.
Not what I was looking for…
It’s a good source for company information and research tools for ideas on investments. But it’s not what I was looking for in a research platform for $150 a month. Not much news information if you want to keep up with what’s going on in the markets. So for $150 a month you can do way better elsewhere.
The Coach tells you right off…
The Coach tells you right off that the service passes stock selection to the customer and makes no suggestions. I suppose that an investor that has nothing else to do but chart, analyze and select, will find MARKETSMITH WORTH $169 a month. If not that committed, Leaderboard makes decisions as to the BUY POINT but gives no predictive clues in my opinion. Never take a major position without a trailing stop loss and always have a breakthrough investment with a buy parameter.
A valuable resource to select stocks based on fundamentals…
I found this cloud-based software to be a valuable resource to select stocks based on fundamentals. The stock chart view lacks many functions available on free viewers. Specifically, there is no ability to zoom the charts for a specific time frame. No open-low-high-close or candlestick charts available. No indicators available other than moving averages. The stock news is ridiculously limited to only what is sourced from either yahoo or the investors business daily. During the trading day, their back-end servers seem to bog down making the response time so slow that the tool is effectively useless. On my beefed up Macintosh systems, the tool frequently locked up and displayed an error message encouraging exiting the program to improve responsiveness. To summarize, Marketsmith is a useful tool to screen stocks on fundamentals, but at a price of $150/month, the missing features for graphing stocks, no indicators, and poor functionality encouraged me to cancel my subscription and look for another tool.
Great info but antiquated technology…
Great info but antiquated technology. Looks like a website from 15 years ago. Upgrade your tech already.
Definitely one of the best in business…
Definitely one of the best in business for both individual and institutional investors! Highly detailed and full of tools and settings to optimize your research and make weighted decisions. Quick and friendly support. Lots of education available on investors.com for free. Highly recommended!
I have never seen better for individual investors…
Great charting with fundamental/technical indicators for comparison and timing elements. I have never seen better for individual investors. Lots of transparent structure and options to customize, In combination with regional meetups and educational products, IBD’s Marketsmith is well worth the subscription.
If you’re a CAN SLIM investor…
If you’re a CAN SLIM investor, MarketSmith is a tool that will make your life a whole lot easier. William O’Neil’s rules and strategies are nicely integrated into the platform and it will save you a lot of time when screening for stocks and performing in-depth research.
Submit a Review
Have you tried IBD’s MarketSmith charting platform? If so, please let other traders know what you think about it.
MarketSmith Walkthrough [VIDEO]
Pricing: How Much Does MarketSmith Cost?
Investors Business Daily offers a monthly subscription to MarketSmith for $149.95. This of course includes the premium Pattern Recognition functionality, one on one product coaching, webinars, and the quarterly Stock Guide, which is full of expert insights, advice, and other valuable investor information.
FAQs
For serious traders, the $149.95 a month is definitely worth it. It's the best research platform for growth stock investors and CAN SLIM traders.
While there's currently no free MarketSmith trial, Investors Business Daily is currently running a 3-week trial for $19.95.
Leaderboard is better for casual investors who prefer to have all the research work done for them, while MarketSmith caters to advanced, research-driven traders who are more do-it-yourself types.
While there are plenty of excellent stock screeners and research platforms like TrendSpider and FINVIZ Elite, there's nothing quite like MarketSmith if you're a follower of William O'Neil's CAN SLIM system. If CAN SLIM is not your focus, both of the above alternatives are excellent platforms for performing market research.
Pros and Cons
Pros
Cons
- Ideal for CAN SLIM investors with built-in screens and strategies
- Focuses on both fundamentals and technical analysis
- Saves a ton of time when searching for the best growth stocks
- Easy navigation with all essential features and tools on one page
- IBD has a solid community with webinars and expert guidance
- A bit pricey for the casual investor
- No free trial
- Only one subscription plan
Best for?
MarketSmith’s research platform is best for the serious investor who is willing to pay for a premium research tool that makes it much easier to find winning stocks. From the amazing charts to the top-shelf customer support, the MarketSmith experience is top-shelf.

