

TRY TRENDSPIDER FREE
JOIN THE DISCUSSION
Overview
A powerful technical analysis charting software that combines cutting-AI and automation technology, beautiful design, and an intuitive UI, TrendSpider is an innovative program that’s pushing the boundaries of what’s possible with trading software.
In this TrendSpider review, we’ll take an in-depth look at this highly-advanced stock research platform and discuss its features, pricing, development timeline, pros and cons, and who this software is ideally suited for. Also, we’ll share a special coupon code that you can use to save some money on your TrendSpider subscription.
Software Details
Developer Niche Theory
Type Technical Analysis
Platform Cloud-based application
Subscribers 6,000+
Indicators 75+
Features Alerts, automated analysis, AI integration, backtesting, scanning, multiple timeframe support, notifications (SMS/email/popup), watch lists, notes
Charts Line, Bar, Candlestick, Hollow Candle, Raindrop, Heikin Ashi
Markets U.S. Stocks, ETFs, Indices, Crypto, Pinksheets, Futures & Commodities, FOREX & Currencies
Data Barchart Solutions
Pricing Click Here
Coupon Use promo code TRS25 for 25% off
Community Rating
Photos


About the Developers

Dan Ushman

Ruslan Lagutin

Jake Wujastyk
TrendSpider is a technical analysis software that’s developed by traders, for traders. The company behind the program, Niche Theory, was founded by CEO Dan Ushman and is comprised of a passionate staff of both developers and traders.
Development of the software initially began in 2016 and the user base has since grown to 4,000+ active traders.
In addition to founder Dan Ushman, TrendSpider’s management team includes CTO and co-founder Ruslan Lagutin as well as Jake Wujastyk, VP of business development and partnerships.
How to Use TrendSpider

TrendSpider is extremely user-friendly and due to the fact that it’s cloud-based, you don’t have to worry about downloading and installing software. After signing up (click here for a FREE trial), just log in to your account and you can immediately begin setting up your first TrendSpider workstation.
While TrendSpider’s layout is extremely user-friendly, there are a lot of features that you’ll want to familiarize yourself with. The developers have produced a large number of educational resources including videos in the TrendSpider University training center that we’d highly recommend going through. Additionally, you can set up a FREE one-on-one training call where a member of TrendSpider’s team will personally walk you through everything and answer any questions that you may have about the platform.
TrendSpider Features
TrendSpider comes loaded with powerful features that can help you with your chart analysis and trading. Unlike several other charting platforms that are long in the tooth and severely lagging in terms of innovation, TrendSpider is being actively developed with new features and technical indicators being introduced on a regular basis..
Beautiful User Interface

One of the first things you’ll notice about TrendSpider after logging in is the stunning user interface. The developers have done a wonderful job of designing this platform and we love the clean layout and modern feel of the workstation. The charts produced by the software are gorgeous and very easy on the eyes, and everything can be customized based on your individual preferences. Technical analysis tools are incredibly complex and giving users access to the many features without cluttering up the UI is an impressive feat.
Cross-Platform Compatibility
TrendSpider is a cloud-based application that can be accessed from your browser. Currently, there are two browsers officially supported: Google Chrome, and Mozilla Firefox. While we love the cross-platform compatibility of TrendSpider, we’d love to see a mobile app developed in the future as it’s currently not well-optimized for smartphone usage.
Charts

The charts produced by TrendSpider are good-looking and you have many types to choose from, including line, bars, candles, hollow candles, Raindrop, and Heikin Ashi. Price scale can be set to Linear or Logarithmic and there are options for viewing extended hours data, grid lines, countdown to close of current period, and more.
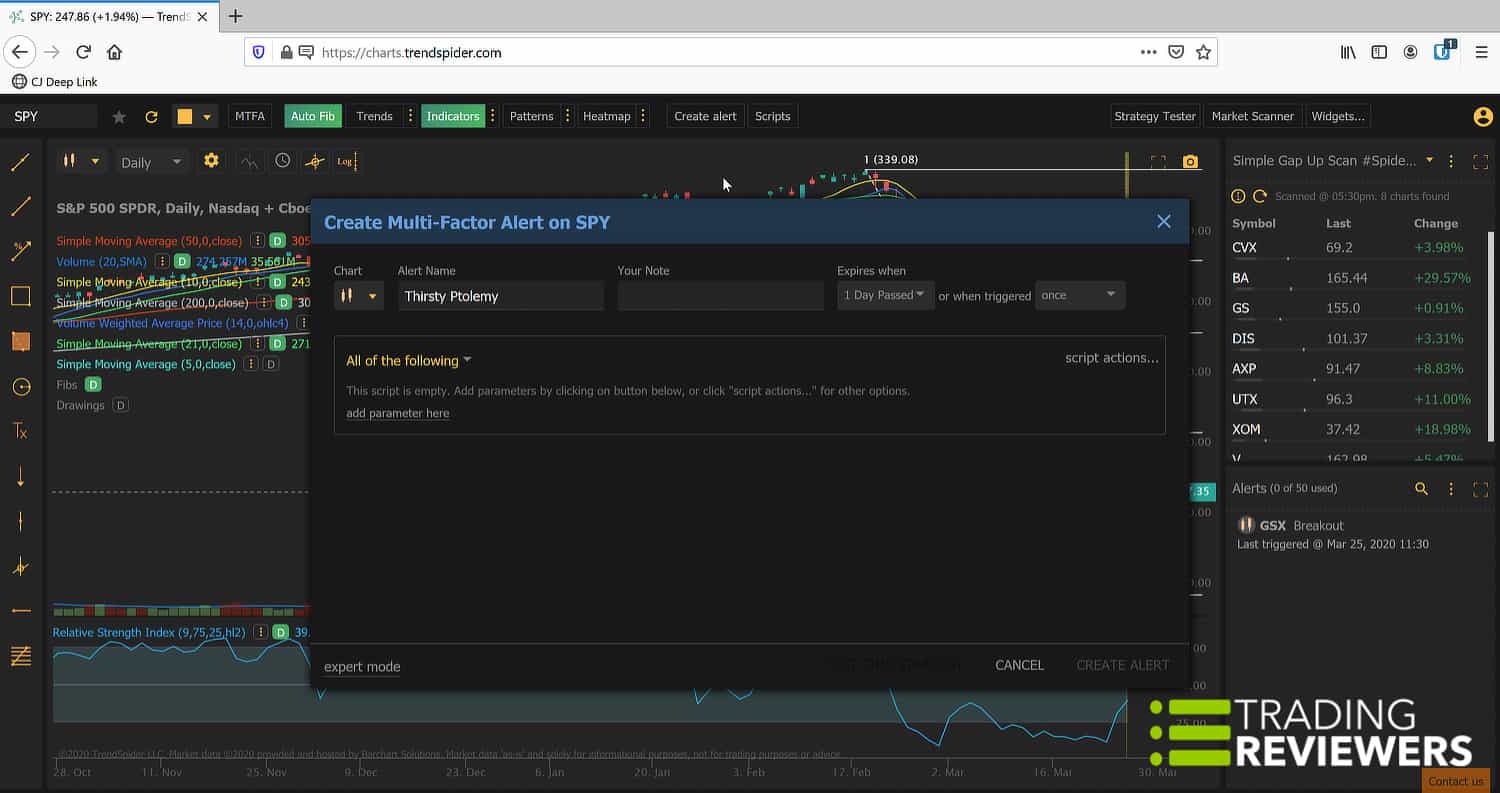
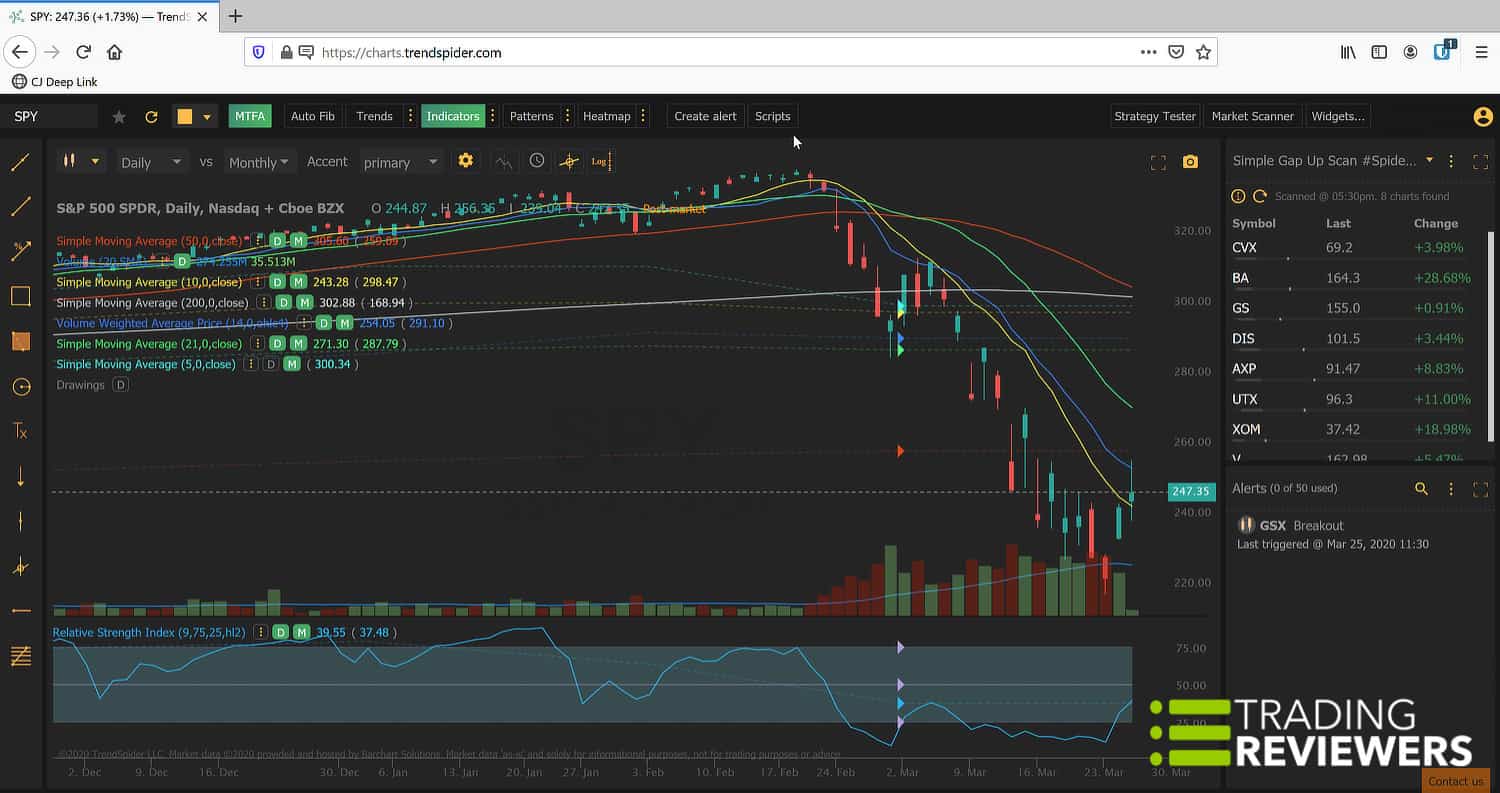
Alerts
TrendSpider features a highly-sophisticated, multiple timeframe alerts system that allows you to receive SMS text, email, or popup alert notifications based on any number of parameters. Dynamic price alerts provide automatic “Break Through”, “Touch”, or “Bounce” notifications using volume or price action, moving averages, MACD, candlestick patterns, stochastics, trendlines, and much more. TrendSpider also allows you to set the sensitivity of the alert, allowing it to go off a bit earlier than your specified target. TrendSpider’s highly developed alert system allows you to create notifications ranging from simple to the most complex and the software even gives you the ability to clone and save your alerts as templates. You can also set an expiration for each alert and the number of times you’d like it to trigger.
Automated Technical Analysis
TrendSpider takes out a lot of the work required for technical analysis through the use of its powerful automation engine, making life a whole lot easier when it comes to studying and analyzing charts. The “Auto Fib” feature creates Fibonacci retracements with the click of a button and the software’s “Trends” algorithm works behind the scenes for you, finding every possible trend, scoring them, and displaying the top 1% on your chart. You can also choose “More Lines” and “All (Unfiltered)” to return more results.
You can also change “Trends Analysis Preferences” to input your desired settings for “Analysis Type” (Original, Enhanced, or Standard), “Drawing Input” (Wick or Body), and Islands/Gaps (Ignore or Respect). At the bottom of the screen in the volume area is a “Truth in Analysis” timestamp marker which simply gives you the exact date and time the TrendSpider drew the existing trend lines on the chart. “Refresh and Lock” or CTRL + R on your keyboard will update the trend lines taking into account all new data since the last update.
Multi-Time Frame Analysis
Long term trends can greatly impact short term prices and TrendSpider’s MTFA (Multi-Timeframe Analysis) feature allows you to plot a variety of indicators and trend lines from multiple time frames on a single chart. It can be toggled on and off by simply clicking the button at the top of the screen and you can choose from four different accents: primary, secondary, both, and neither.
AI Integration

TrendSpider’s intelligent AI-powered engine makes technical analysis a breeze, cutting down the time it takes you to review charts and helping you to spot opportunities that you may have otherwise missed. TrendSpider analyzes stock charts and automates candlestick pattern recognition, support and resistance trendlines, Fibonacci retracements, and more.
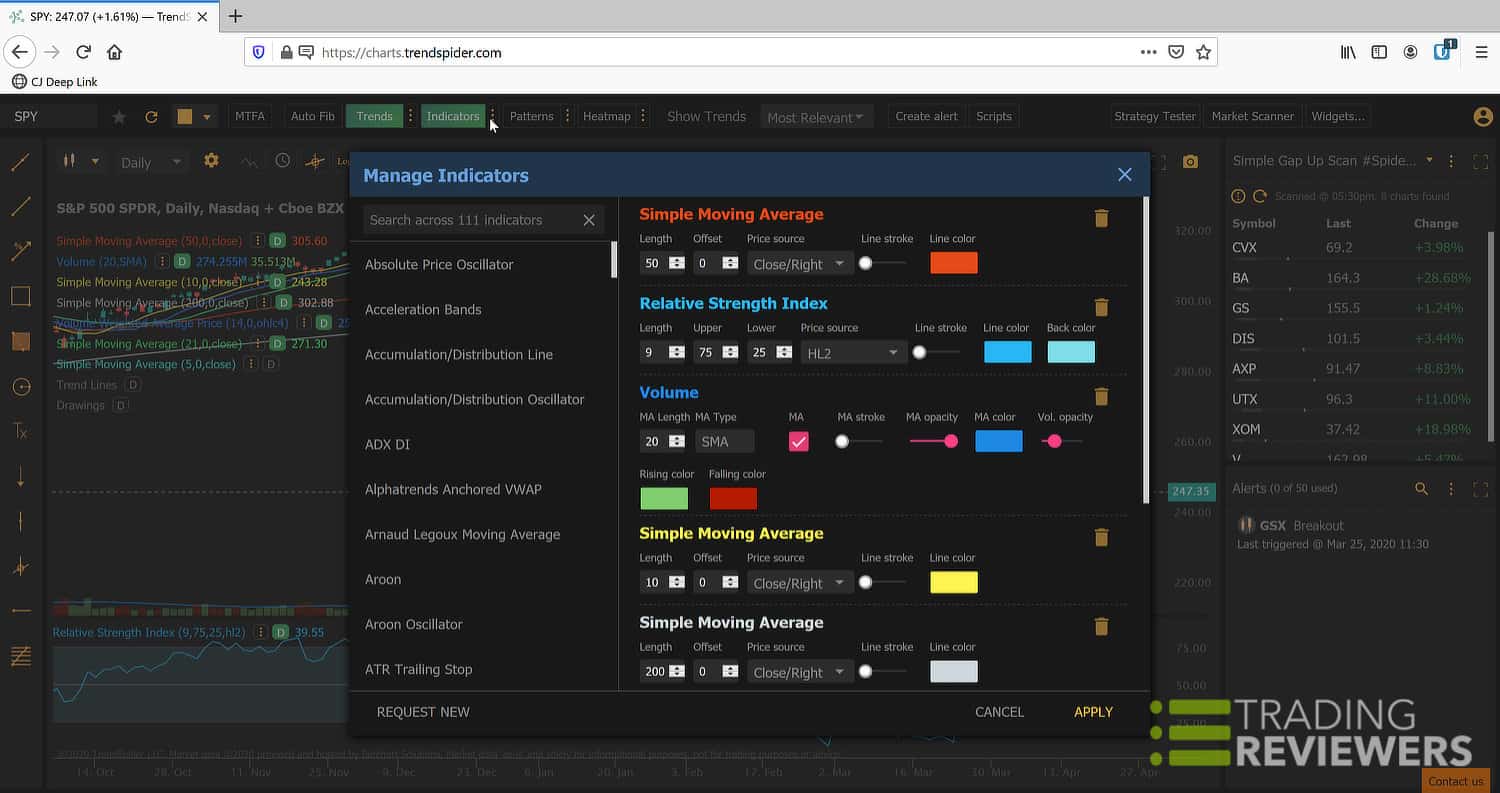
Indicators
Built-in to the TrendSpider charting software are hundreds of indicators. Adding them to charts is super easy — simply type in what you’re looking for, select it, add your custom settings, and click “Apply”. In addition to the standard indicators found on most other TA programs such as moving averages, MACD, RSI, and Bollinger bands, TrendSpider also includes a number of premium technical indicators including Alphatrends’ anchored VWAP, anchored volume-by-price, support and resistance heatmaps, gap detection, Rob Smith’s “The Strat” system, and more.
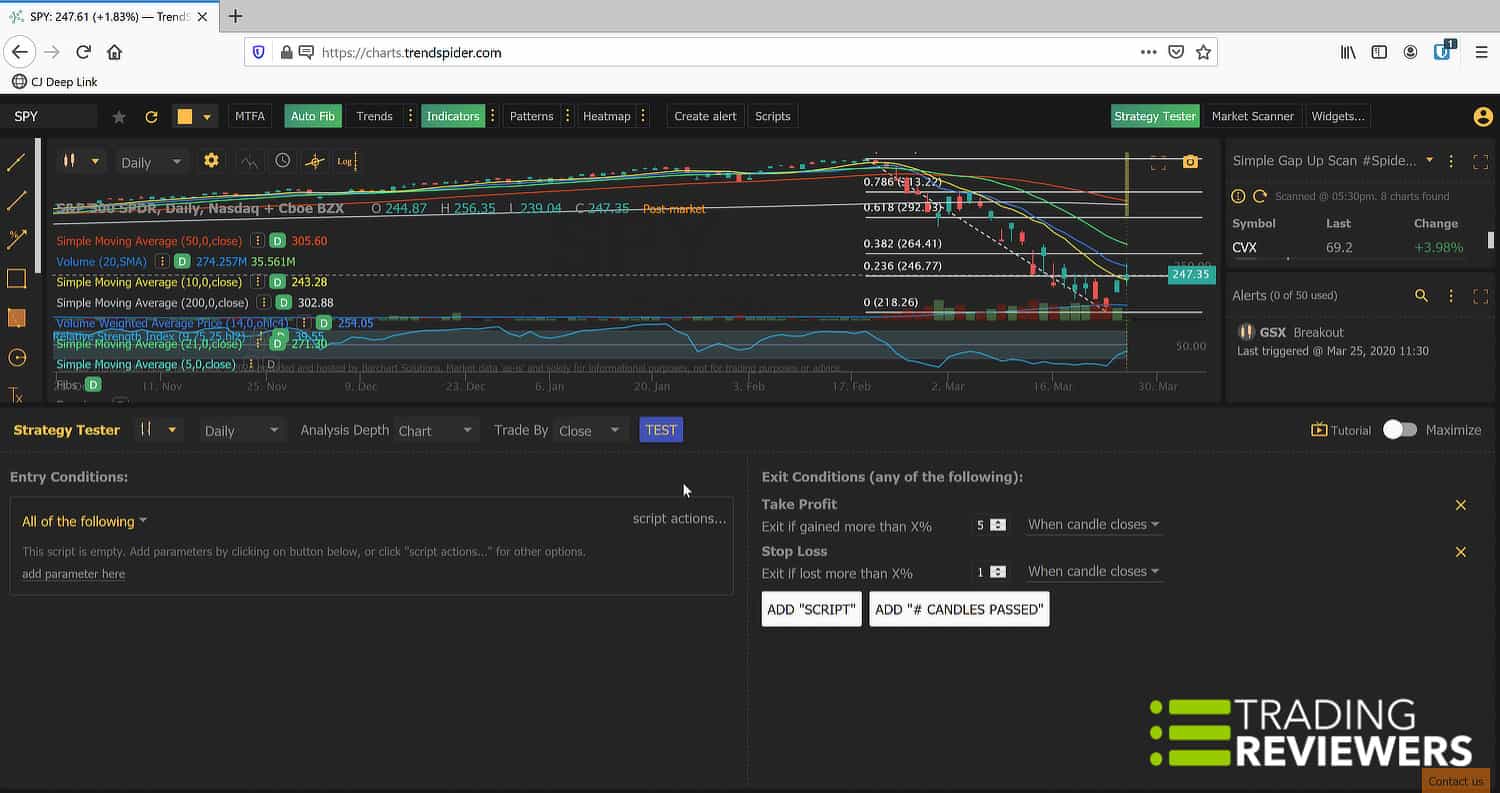
Backtesting
TrendSpider’s built-in Strategy Tester feature allows you to backtest single timeframe strategies and improve the profitability of trading systems. Like everything else with TrendSpider, the backtesting functionality is extremely easy to use and doesn’t require any coding know-how. You can quickly backtest a trading strategy’s profitability using a combination of price action, volume, indicators, chart patterns, and more.
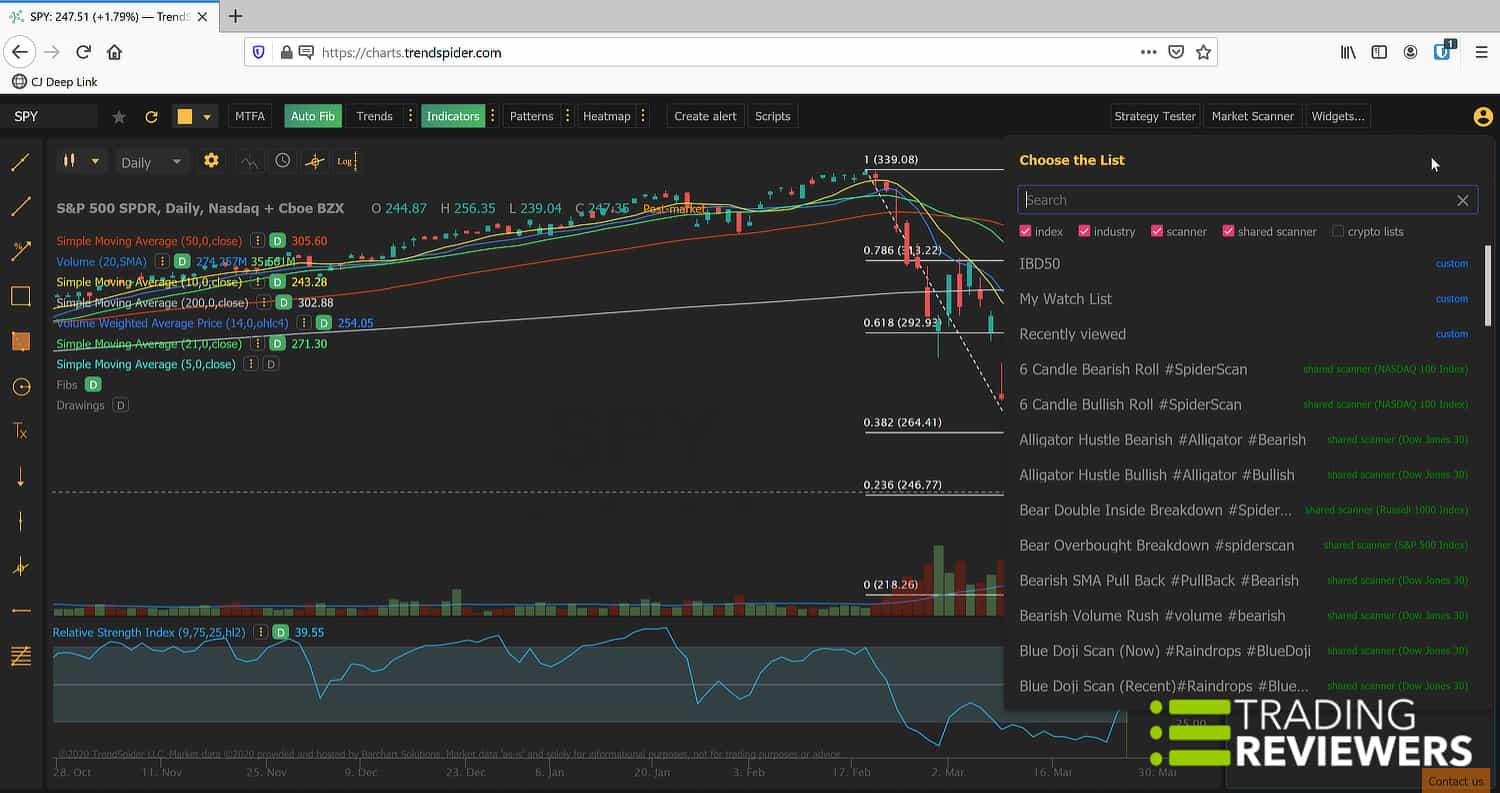
Market Scanner
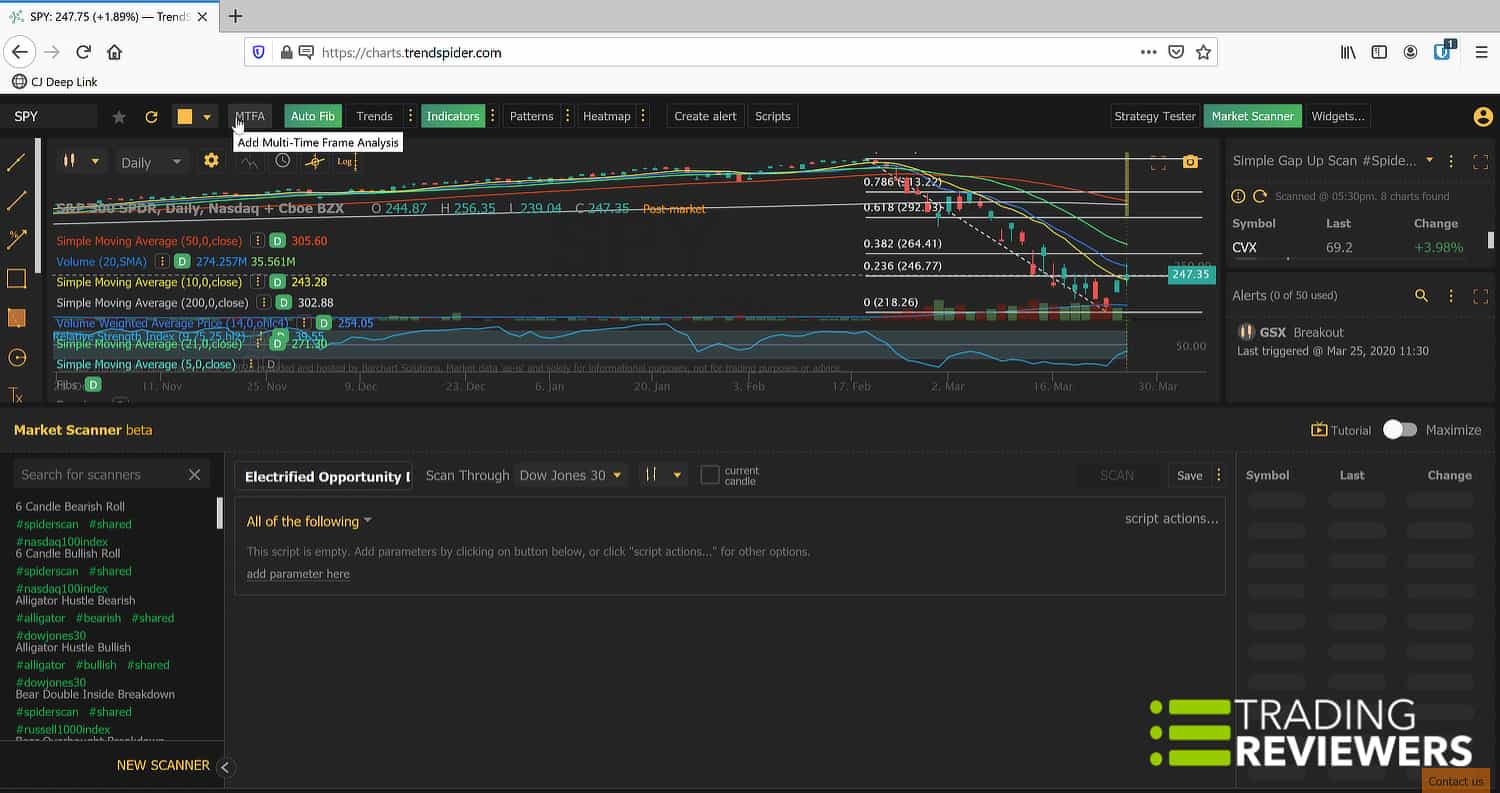
A brand new addition to the TrendSpider platform this year, the powerful scanning feature will help you to find better trade setups, faster. Now, TrendSpider gives you the ability to instantly generate dynamic watchlists based on technical criteria. You can add your own conditions or use any of the application’s automated built-in scans to filter through the market and uncover the best trades. TrendSpider also gives traders the ability to automatically turn the scanner into a watchlist which is extremely convenient.
Notifications
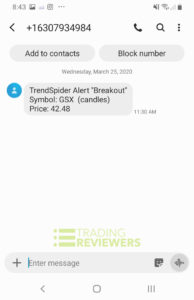
TrendSpider’s alert notification feature is incredibly helpful and ensures that you’ll never miss an opportunity, even when you’re away from your desk. Unless you’re day trading, there’s really no need to sit at your desk staring at monitors all day and TrendSpider’s dynamic alerts notification system will let you know the instant your best trade set ups have triggered. This feature allows you to create alerts using a large variety of indicators and time frames without writing a single line of code and TrendSpider will automatically monitor your charts 24/7, instantly alerting you via in-app notifications, SMS, and email.
Watchlists
TrendSpider’s Watchlist feature makes it easy for traders to create multiple lists. To set up a new watchlist, all you have to do is click the “Widgets” button and then add a new watchlist. In addition to creating watchlists, you can also clone them which is a nice time-saving feature.
Notes
Built-in to TrendSpider is a handy notes feature which gives you the ability to annotate charts. You can add text to any chart by clicking the text tool in the left sidebar.
Customer Support

TrendSpider is one of the most well-supported pieces of software that we’ve reviewed and the developers are proactive and responsive when it comes to providing assistance. After several interactions with their team, it’s easy to see that they love what they do and want their customers to get the most out of this powerful charting software. Product support is available via email, phone, and chat within the application.
TrendSpider Cost
Currently, there are three levels of TrendSpider access:
- Premium
- Elite
- Master
All three packages include the following real-time data sets: US stocks and ETFs, Forex, cryptocurrencies, and OTC/pink sheets.
In terms of cost, there are two payment options, monthly and yearly. All of the yearly TrendSpider plans feature significant discounts over the per month payments:
- Annual Premium plan: 36% discount
- Annual Elite plan: 38% discount
- Annual Master plan: 43% discount
Monthly Plan Pricing
Premium
7 days FREE
-
Workspaces (2)
-
Alerts (25)
-
14-day alerts
-
1-hour scanner
-
25 scan results
-
1 training session
Elite
7 days FREE
-
Workspaces (4)
-
Backtesting
-
Alerts (75)
-
Multi-factor alerts
-
30-day alerts
-
1-minute scanner
-
75 scan results
-
Unlimited training
-
Phone support
-
Priority service
Master
7 days FREE
-
Workspaces (6)
-
Backtesting
-
Alerts (175)
-
Multi-factor alerts
-
90-day alerts
-
1-minute scanner
-
175 scan results
-
Unlimited training
-
Phone support
-
Priority service
-
Beta access
Yearly Plan Pricing
TrendSpider Coupon Code
Here’s some good news for anyone who has been searching for TrendSpider offers that’ll allow you to get access to the software for a lower subscription price. We’ve been able to work out an exclusive deal on TrendSpider for the Trading Reviewers community — just use the promo code TRS25 when checking out for a 25% discount on your TrendSpider membership. This offer is valid for up to 12 months.
Development Timeline
2016
Official Launch
TrendSpider was officially launched in 2016.
February 2019
Conditional Alerts Added
Complex conditional alerts, manual trendlines, and streaming real-time data added to the platform.
April 2019
Strategy Tester Added
New strategy tester added to the software, giving users the ability to backtest trading strategies.
May 2019
Raindrop Charts Added
Added to the TrendSpider platform is the company’s proprietary Raindrop Charts which incorporate volume to validate price moves.
June 2019
CBOE Indices & CBE/ICE Futures
Data feeds for CBOE inices and CME/ICE futures added.
July 2019
AlphaTrends VWAP Added
TrendSpider’s platform gets upgraded with a new indicator — AlphaTrends’ Anchored VWAP.
August 2019
Fibonacci Upgrade
Manual Fibonacci levels added to the platform.
August 2019
Volume-by-Price Heatmap
The TrendSpider platform continues to grow with the addition of a new volume-by-price heatmap.
October 2019
Price Behavior Projection
TrendSpider now gives users the ability to overlay a price behavior chart onto live price action.
February 2020
Market Scanner Added
Robust stock scanning functionality added to the platform.
April 2020
Notifications Feed Widget
Notifications feed widget added for better organization.
May 2020
MTFA for Candle Patterns
Multi Timeframe Analysis for Candle Patterns integrated into the platform, giving users the ability to overlay larger timeframe candlestick patterns on lower timeframe charts.
Reader Reviews
A cutting edge charting platform that gives you a lot of value for money..
A cutting edge charting platform that gives you a lot of value for money. As good as TrendSpider already is, it just keeps getting better with the continued rollout of new features and improvements. A highly recommended software application for serious traders who want to take their technical analysis of the markets to another level.
Submit a Review
Have you used the TrendSpider charting software? If so, let other traders know what you think about it…
TrendSpider Review Video
TrendSpider FAQs
TrendSpider's useful S/R Heatmap feature automatically highlights areas of interest in a chart, such as gaps, support, resistance, and consolidation. To turn on this feature, just click the Heatmap button at the top of the screen. Then, you can change the Heatmap preferences by clicking the three vertical lines next to the Heatmap button. There are currently three types to choose from: horizontal, depth, and trends.
You can make any panel in a TrendSpider workspace larger by clicking the square icon in the top right corner of the panel. When hovering over it, you'll see: "Toggle maximize this chart" or "Toggle maximize this panel".
At this time, TrendSpider is strictly a charting platform and cannot be integrated with any online brokerage platform.
Final Thoughts
Pros
Stunning design, beautiful charts, intuitive layout, wide selection of analysis tools and technical indicators, time-saving automated charting including auto Fibonacci retracements and trendlines, multi-timeframe analysis (MTFA) helps to identify higher-percentage trades, dynamic alerts, outstanding support, easy to set up, highly customizable, new features and functionality added on a regular basis
Cons
No mobile app at this time, currently no broker integration
Best For?
Traders who are looking for a cutting-edge automated charting tool that'll save you time and increase efficiency

