
SIGN UP FREE
JOIN THE DISCUSSION
What is Chartlog?
An analytics and journaling platform for active day traders, Chartlog is one of the best solutions available for tracking trade strategies, P/L, and more. This browser-based software program features a stunning UI and its ease-of-use allows you to immediately get things up and running after your first login.
Software Details
| Developers | Adrian Campos and Igor Milivojevic |
| Launched | 2019 |
| Platform | Browser-based |
| Users | 1,000+ |
| Included | Trade journal, detailed analytics, automatic data import, interactive charting, equity graph, positions log, strategy tracking |
| Subscriptions | Free, Pro |
| Price | Click here |
| Coupon Code | TRADINGREVIEWERS2021 ($100 off annual plan) |
Community Rating
Photos

About the Developers
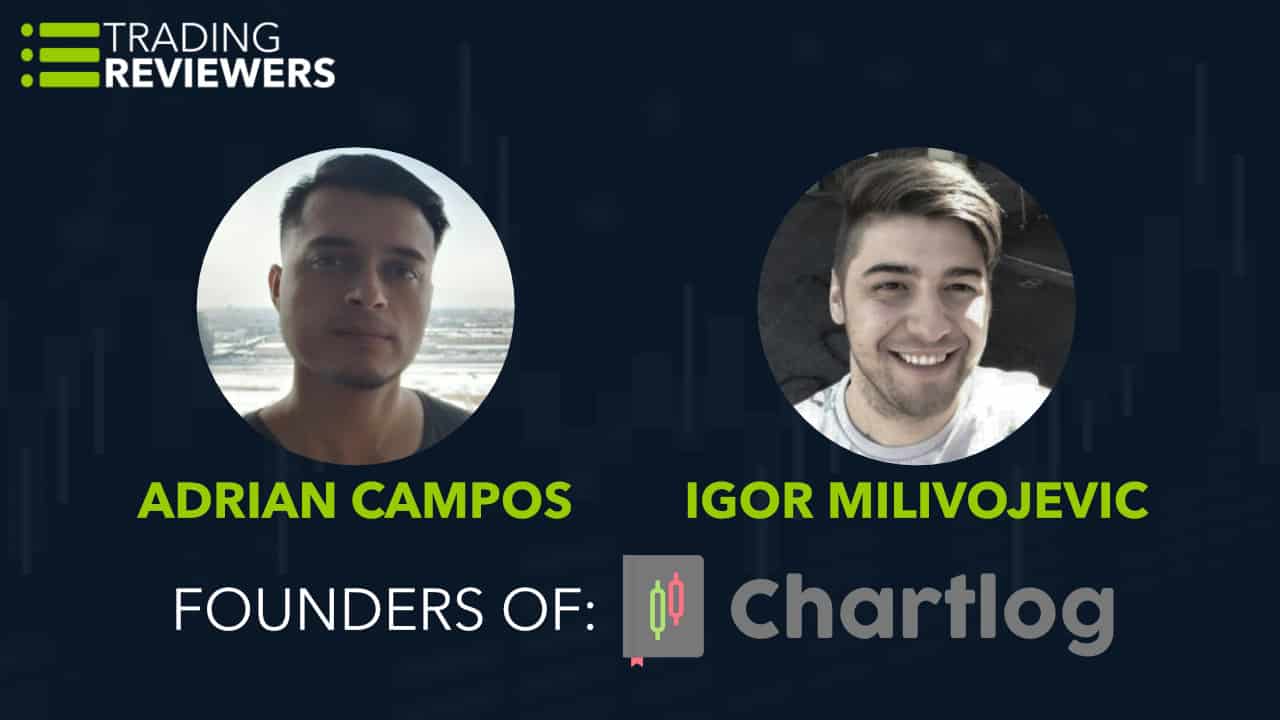
Chartlog was founded by Adrian Campos and Igor Milivojevic, day traders and software developers who wanted a better solution for journaling and trading analytics than what was currently available. Both members of the same trading community (Bear Bull Traders), Adrian and Igor were independently working on trading journal applications at the same time and decided to collaborate and form a partnership. The result is Chartlog, which was initially launched in 2019.
What's Included
Since the Chartlog’s launch, platform functionality has continued to grow with the introduction of the following features:
- Strategy tracking
- Strategy checklists
- Chart themes
- Chart studies
- Chart templates
- “Insights” analytics
- Manual adding of commissions
- Swing trade support
- Ability to populate account with dummy data on signup for “sandbox mode”
- Rapid expansion of “Insights” analytics, allowing users to create their own data sets and dashboards using bar charts, line graphs, pie charts, etc
- Integration of 10 more trading platforms and brokers
- Integration of first direct access broker (Interactive Brokers)
- Options trading support
- Data export functionality
In the following sections, we’ll take a detailed look at the features that are currently available on the platform…
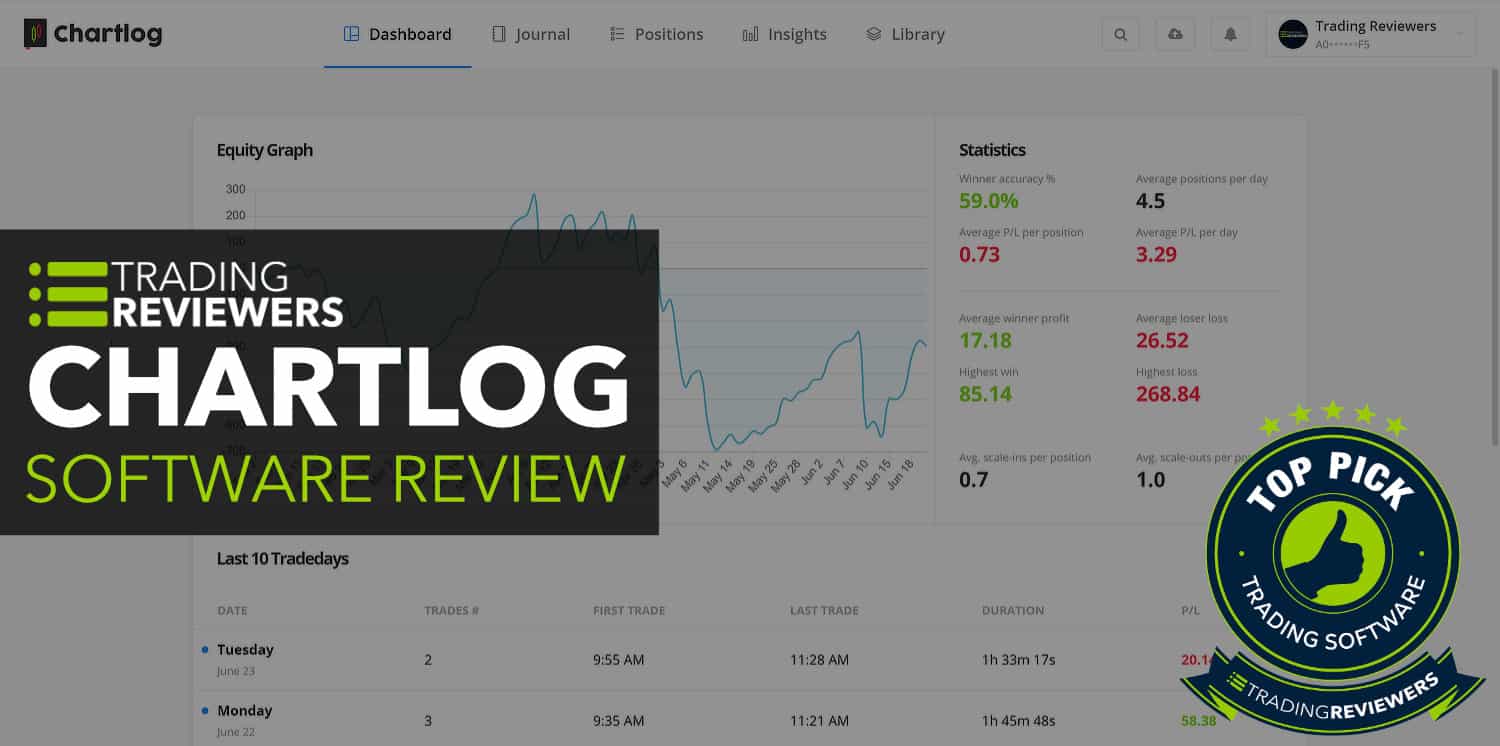
Beautifully Designed Dashboard
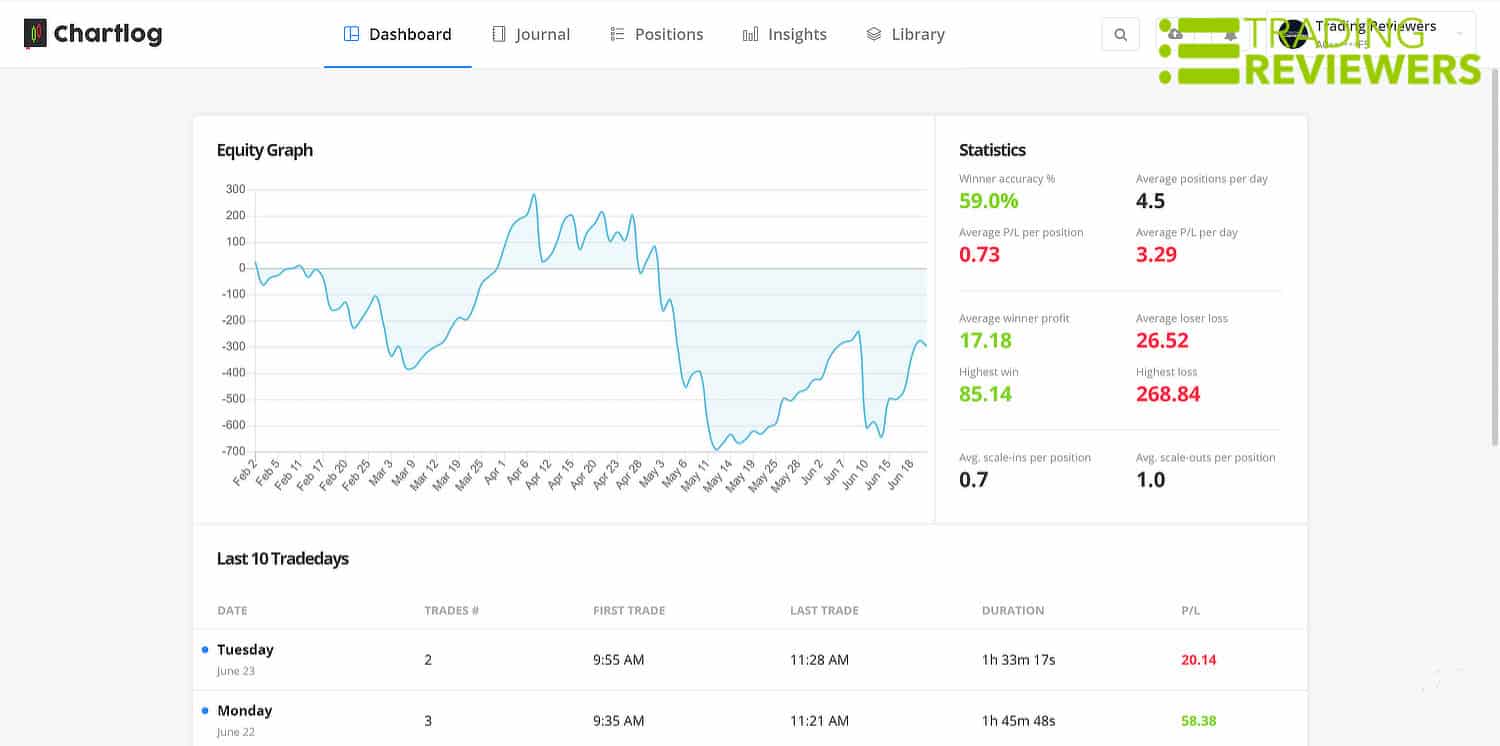
Traders who have previously used other analytics software or spreadsheets to track their performance will be blown away by Chartlog’s clean, modern interface. Well-organized and beautifully designed, Chartlog’s dashboard is easy on the eyes and a breeze to navigate, giving you instant access to the data and visuals you need to make better trading decisions.
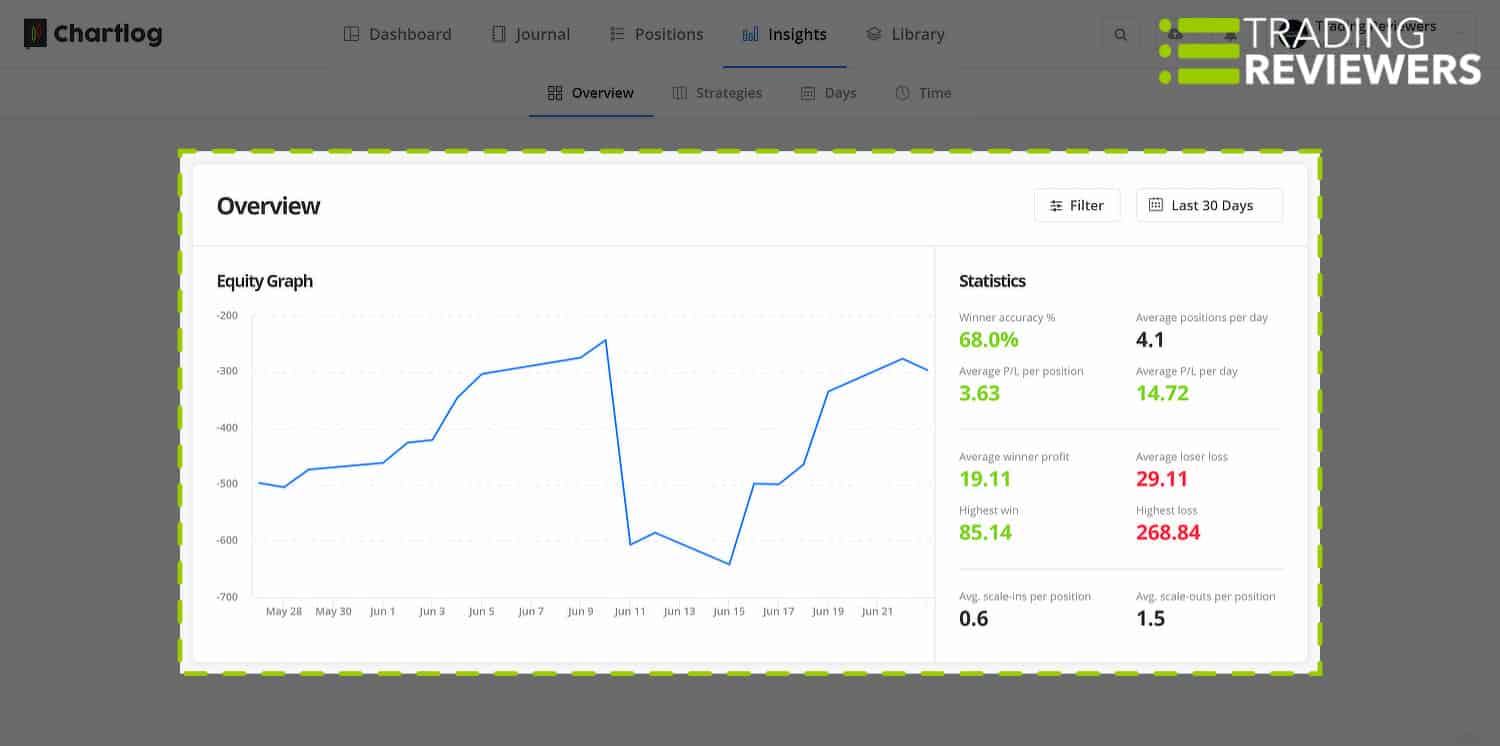
Detailed Statistics
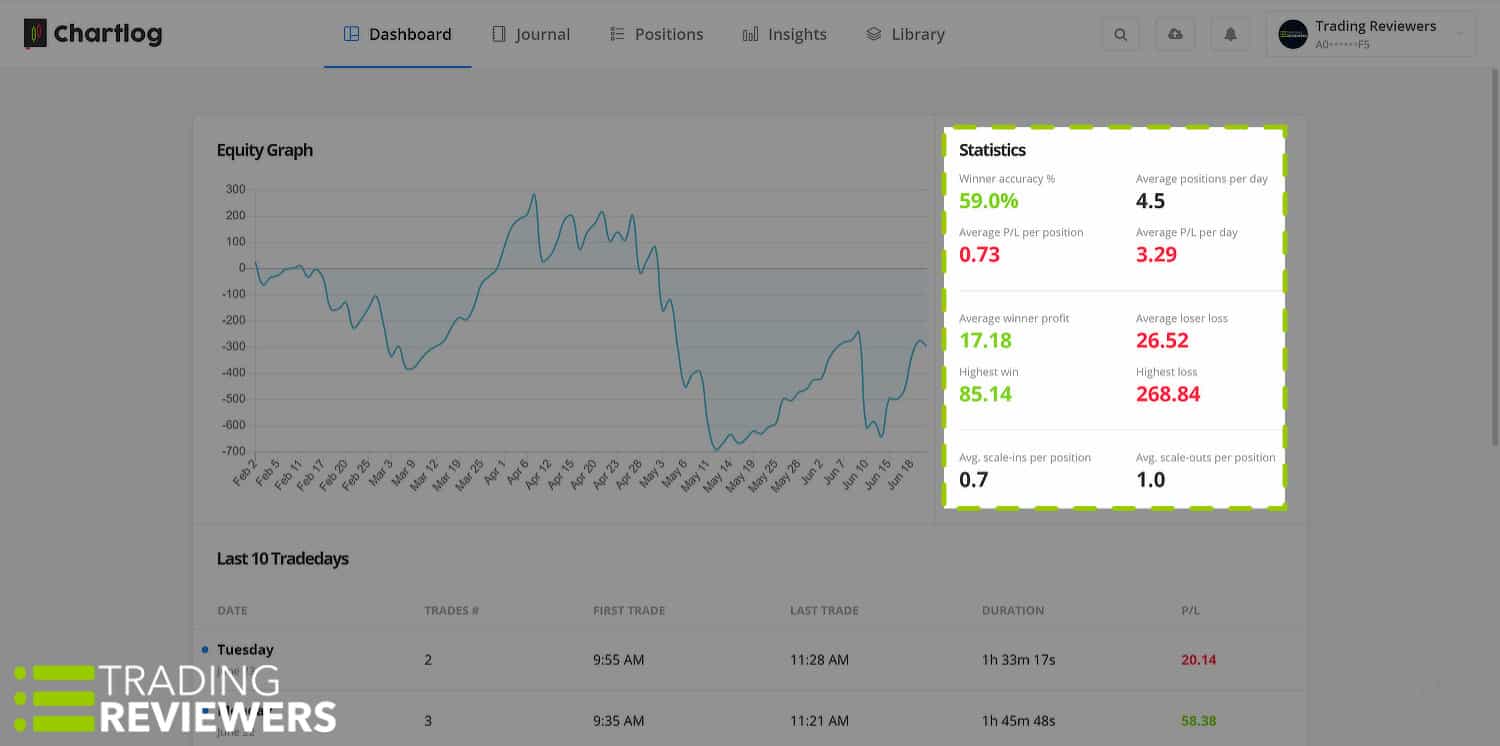
As you’d expect, Chartlog provides detailed statistics on your previous trading history — something that smart traders review daily in order to correct mistakes and improve overall performance.
At a glance, Chartlog will provide you with the following data:
- Winner accuracy %
- Average P/L per position
- Average positions per day
- Average P/L per day
- Average winner profit
- Average loser profit
- Highest win
- Highest loss
- Average scale-ins per position
- Average scale-outs per position
In the dashboard area, Chartlog also displays stats from the previous 10 trading days, including the date, number of trades, times of first and last trades, duration, and P/L.
Equity Graph
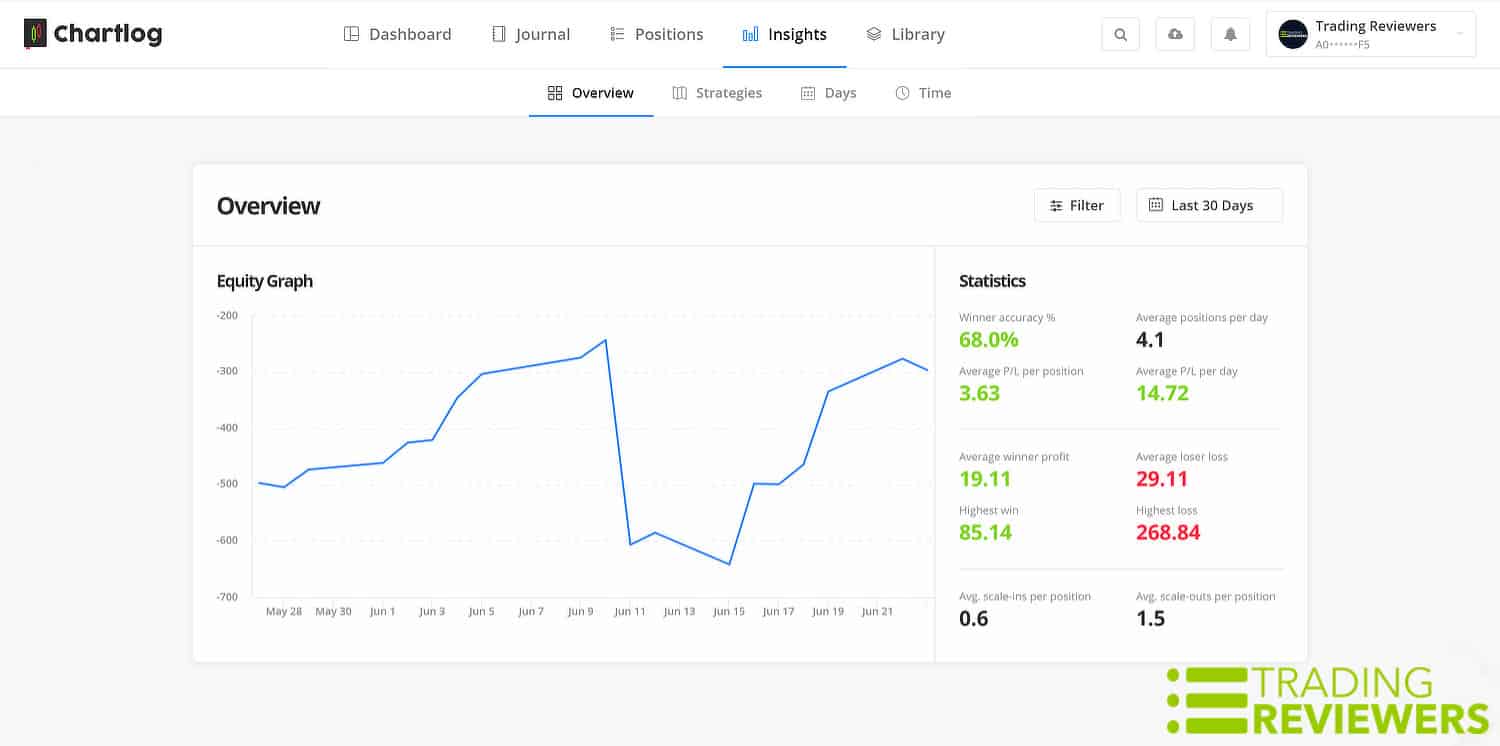
Chartlog’s Equity Graph is clean and easy to read, providing you with a beautiful visualization of your trading performance. The Equity Graph is displayed by default in the platform’s dashboard area, providing you with a line chart of your performance over the previous 5 months. Alternatively, you can access the Equity Graph under the “Insights” tab which gives you the ability to customize the output using filters (symbol, tag, strategy, and shared) and different time frames (today, yesterday, last 7 days, this month, last month, this year, and custom range).
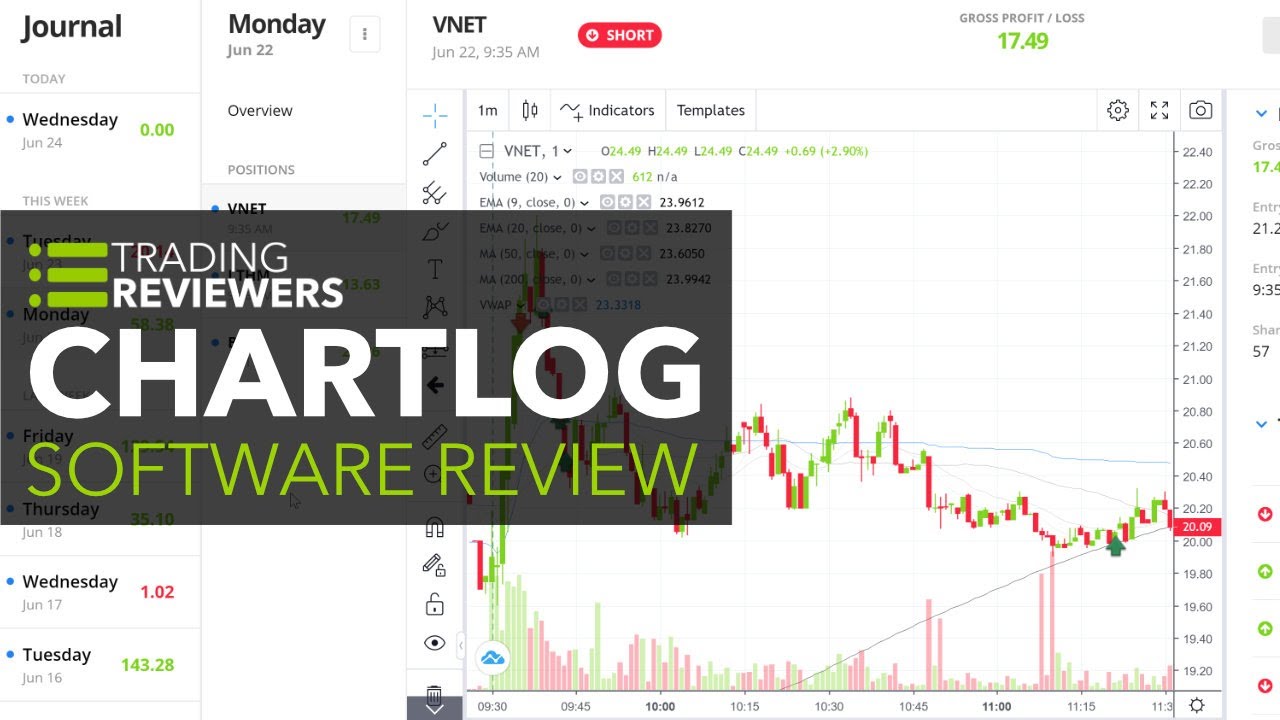
Journaling
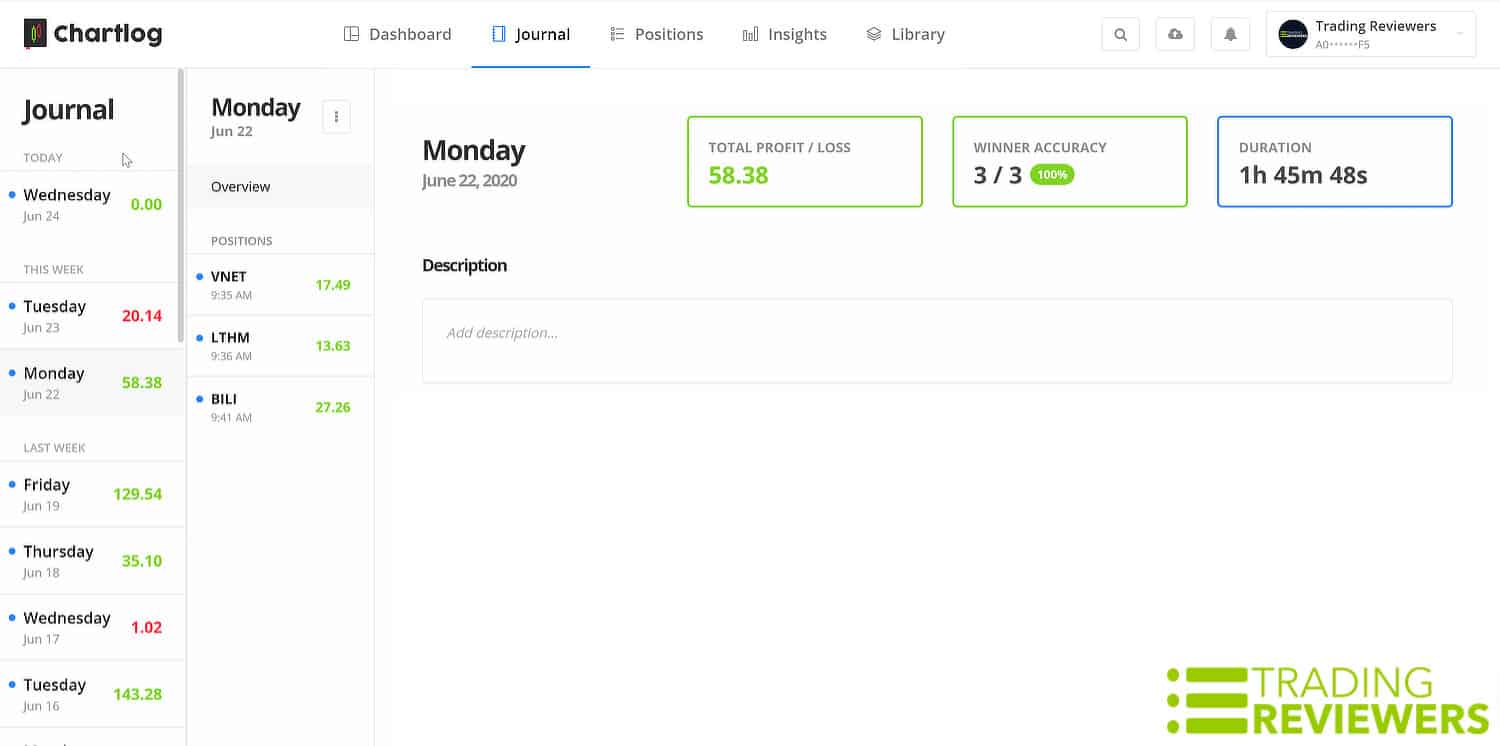
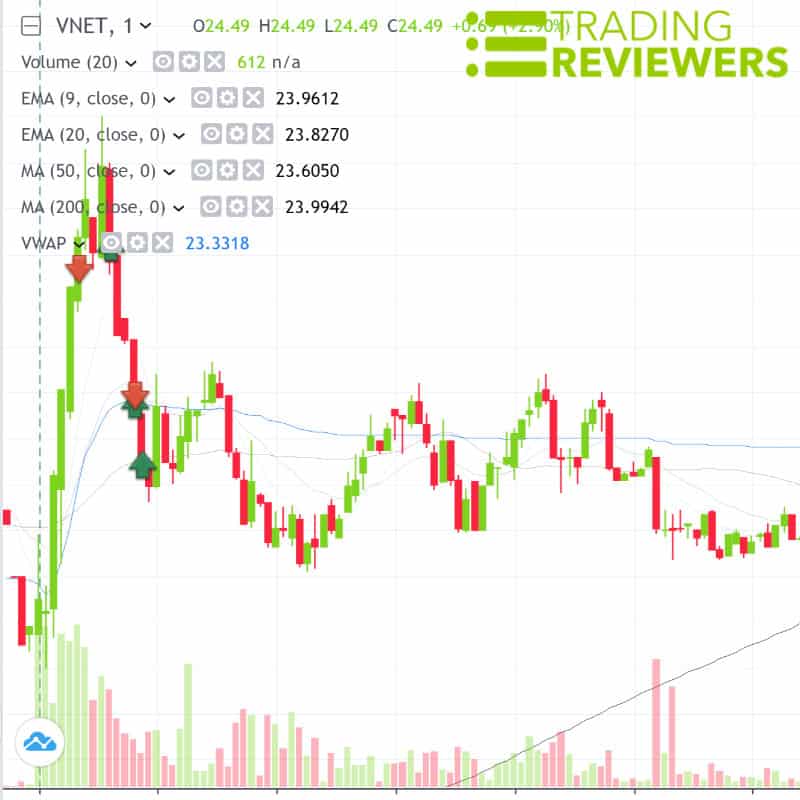
Under the “Journal” tab, you’ll find Chartlog’s handy journaling feature. We love the unique layout of Chartlog’s journal which allows you to quickly access a particular day, review the total profit, winner accuracy, total trading time duration, and notes for the day. Chartlog also lists all positions for that day, and when you click on a position, the software provides you with some additional details as well as an interactive chart that includes arrows showing your entries and exits.
Positions Log
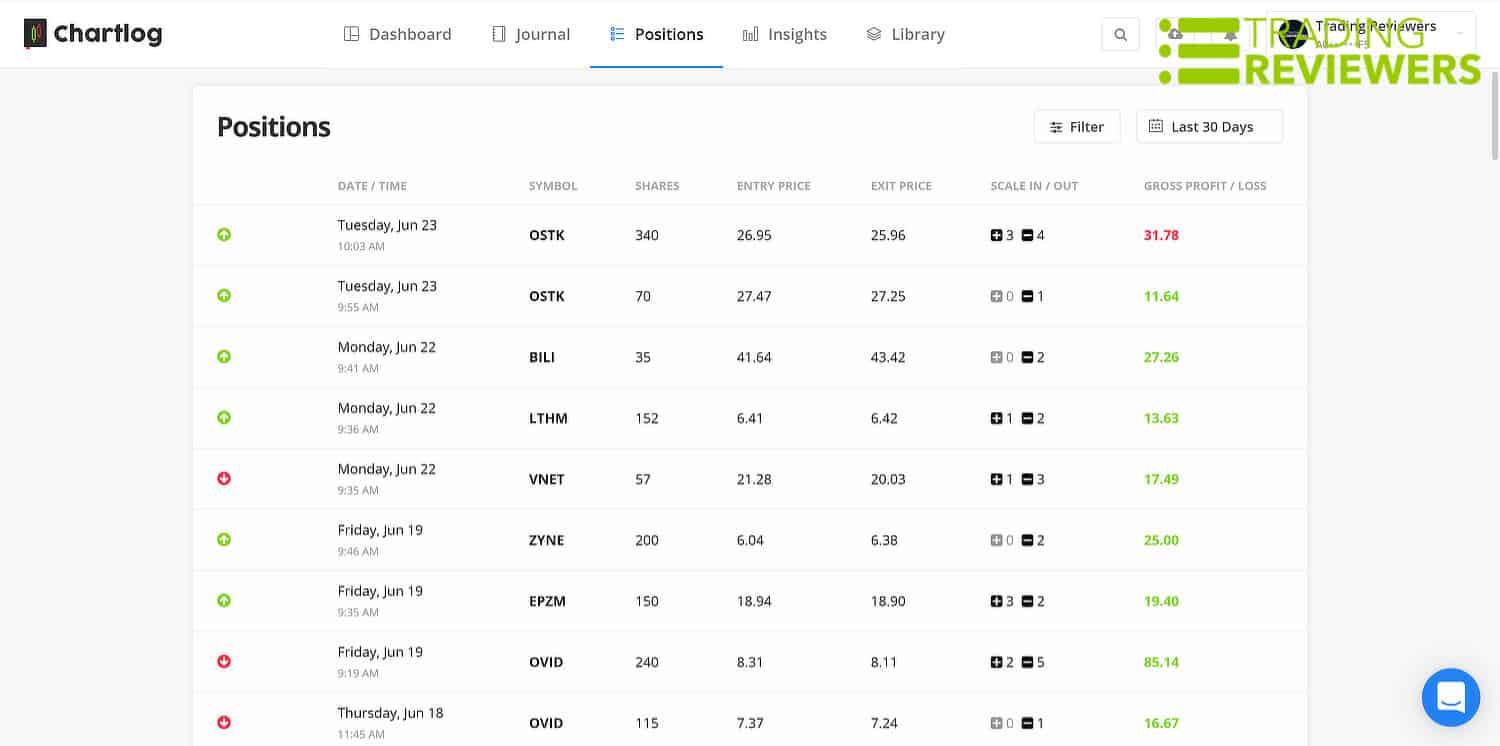
Chartlog’s Positions log gives you an easy to read list of every ticker you traded along with the following data:
- Arrow icon for long/short
- Date/time of trade
- Stock symbol
- Number of shares traded
- Entry price
- Exit price
- Scale in/scale out figures
- Gross P/L
Trading Strategy Tracker
Chartlog also provides users with the ability to track the performance of specific trading strategies. To take advantage of this functionality, you first need to add the strategies that you’re trading under the “Library” tab. Next, you can tag each trade with the appropriate strategy and view the overall performance under the “Insights” tab.
Insights
As mentioned, Chartlog’s “Insights” tab is the area that provides you with a customized view of your trading performance. This page is subdivided into the following four sections, providing you with alternate views:
- Overview
- Strategies
- Days
- Time
Interactive Charts
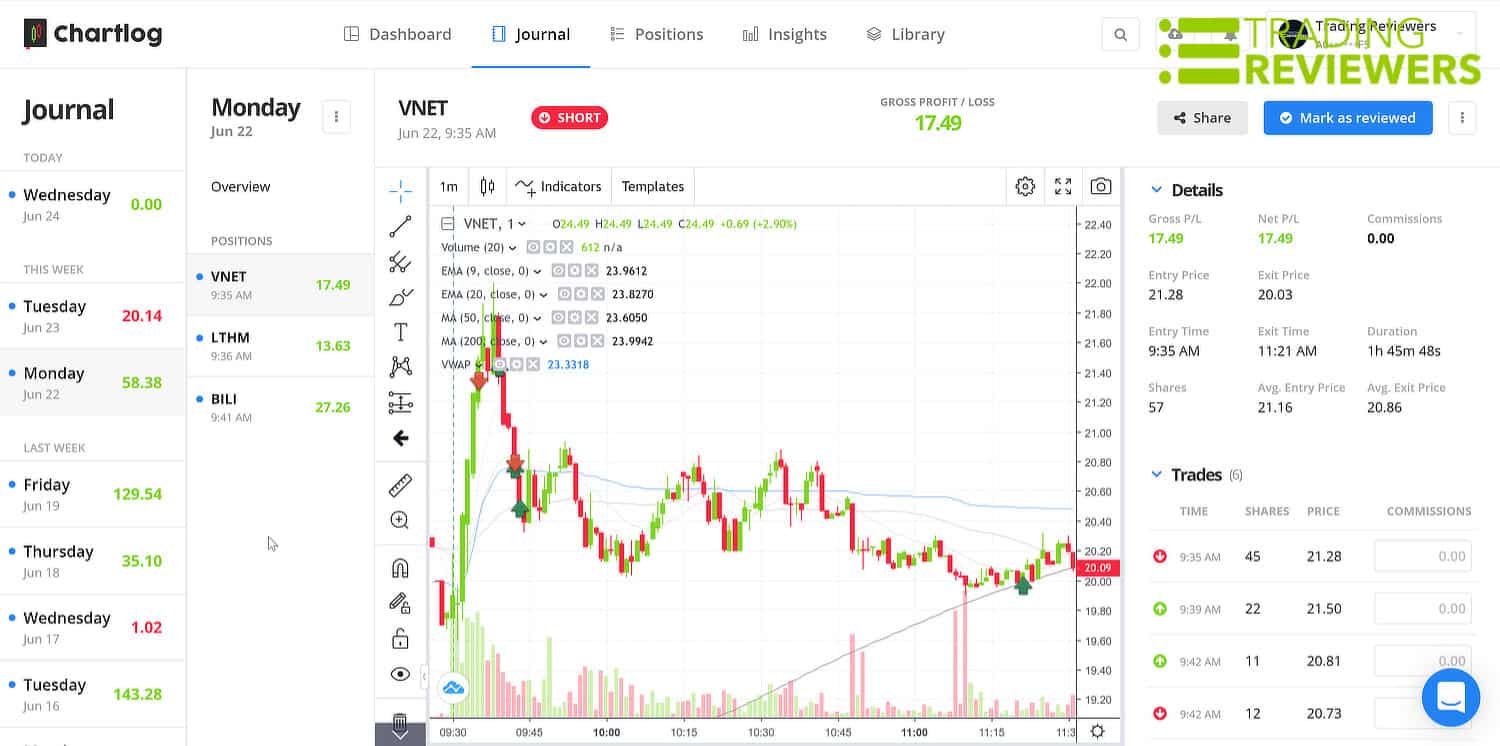
Chartlog pulls in beautiful interactive charts, courtesy of TradingView. In addition to arrows that show your exact entries and exits on a name, Chartlog’s charts offer several markup options as well as the ability to customize them with a variety of indicators and time frames.
Automatic Data Imports
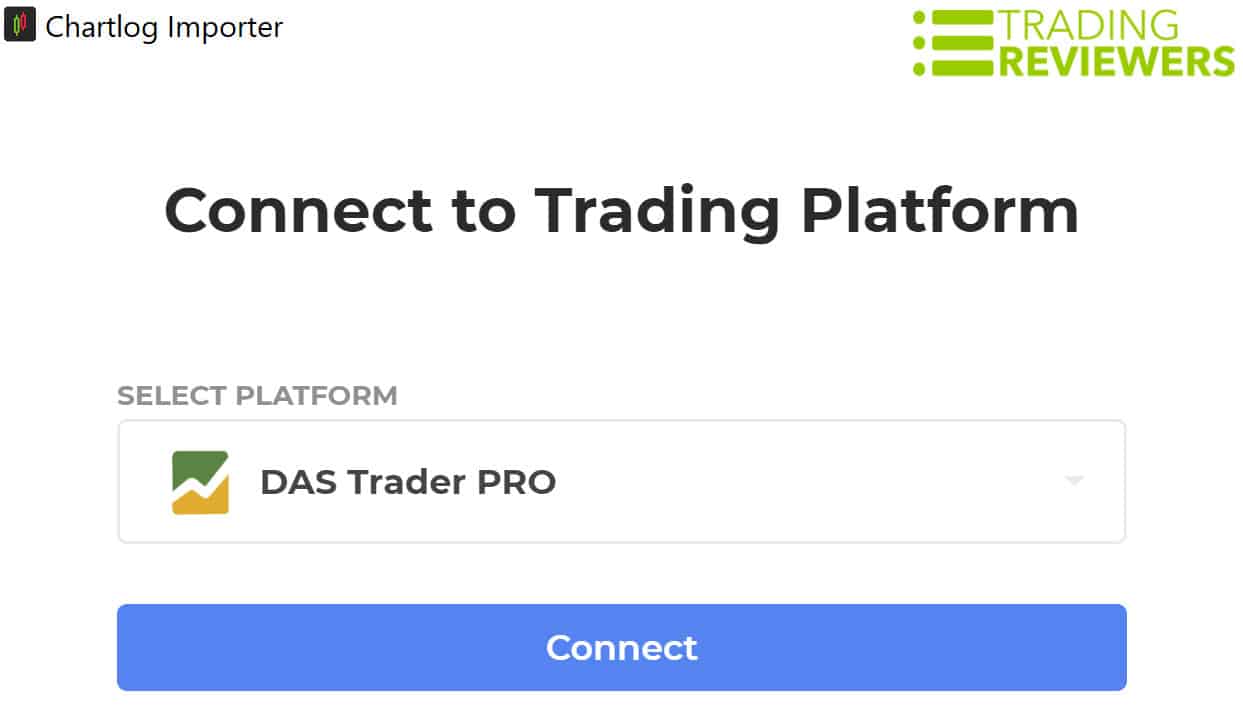
Chartlog also features a custom data import application that automatically connects to your trading platform and imports all trade data in real-time. This is super convenient and a better option than manually importing your trade activity each day, but it currently only works with DAS Trader Pro.
Reader Reviews
What I don’t like…
What I don’t like is that it is not compatible with Etrade and then when you try to format it into csv a bunch of data is not available and it fails.
Your search is finally over…
If you’re a day trader and are tired of tracking your trades in clunky software programs or complicated spreadsheets, your search is finally over. Chartlog is a beautiful and easy-to-use program that provides the detailed analytics and journaling that you need to make better trading decisions. With free and paid subscription plans available, Chartlog is a total no-brainer.
Submit a Review
Have you used Chartlog? If so, please let other traders know what you think about it.
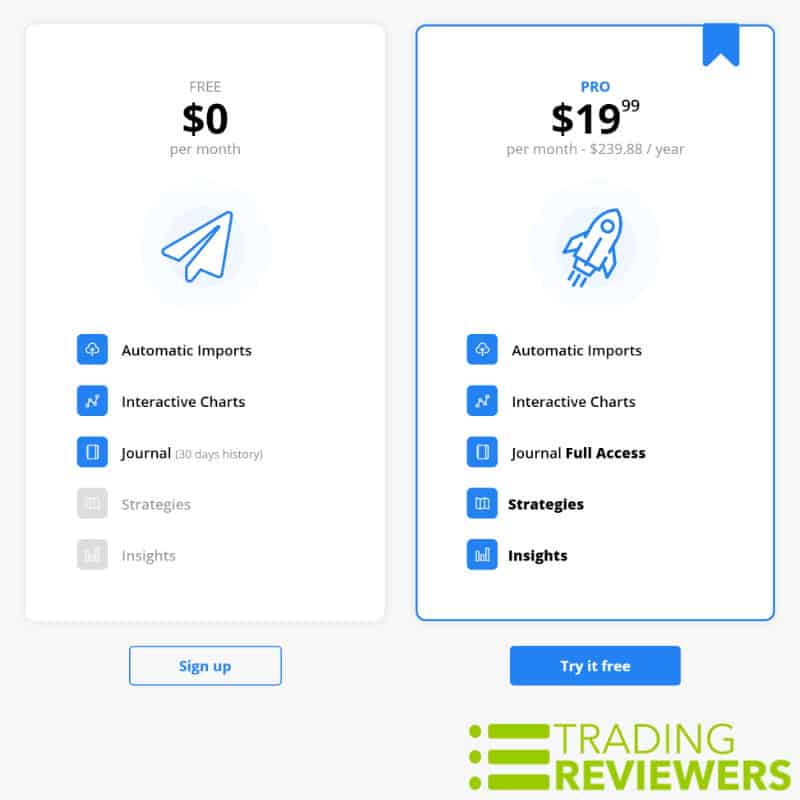
Pricing + Coupon Code Discount
At the moment, Chartlog offers two different types of accounts:
- Free
- Paid (Pro)
We love the fact that the developers have made a no-cost option available to users and believe that many will upgrade to their premium Pro account after spending some time with the system. The cost of Chartlog’s Pro subscription is $19.99 per month and at this time, there’s no discounted annual option offered as you see with most other platforms.
Here’s a comparison chart showing the differences between Chartlog’s Free and Pro accounts:
| MEMBERSHIP | FREE | PRO |
| PRICE | $0 | $19.99 per month |
| FEATURES | Automatic imports, interactive charts, journal (limited to 30 days of history) | Automatic imports, interactive charts, full journal access, strategies, insights |
Chartlog Walkthrough [VIDEO]
(USE TRADINGREVIEWERS2021 FOR $100 OFF)
FAQs
At this time, Chartlog is specifically designed for day traders, although support for swing trading is being added in the near future.
Pros and Cons
Pros
Cons
- Clean, modern design
- Browser-based, works with every operating system
- Easy to navigate
- Free and paid subscription options
- Robust trade tracking and insightful analytics
- Integrated journaling for post-trade analysis
- Interactive charting
- Convenient auto-import feature (for DAS Trader Pro)
- Responsive customer support
- Limited trading platform and broker integration (more coming soon)
- No swing trading support (yet)
- No mobile app at this time
Best for?
Chartlog is ideal for active day traders who are looking for a robust and beautiful trade journal and analytics tracker. Additionally, the Free and Pro subscription options offer something for every trader, regardless of budget.
Typically my approach is more of a swing trader, at times I will catch dividends and it is helpful for me to learn if it was better to sell just prior to the dividend or to catch the dividend, hold for a little while, then sell. Will this program assist me with keeping track of this info?
Would be nice to see it connect with Questrade.
Lionel
Hi Lionel, for your situation I’d recommend TraderSync and it also connects with Questrade.